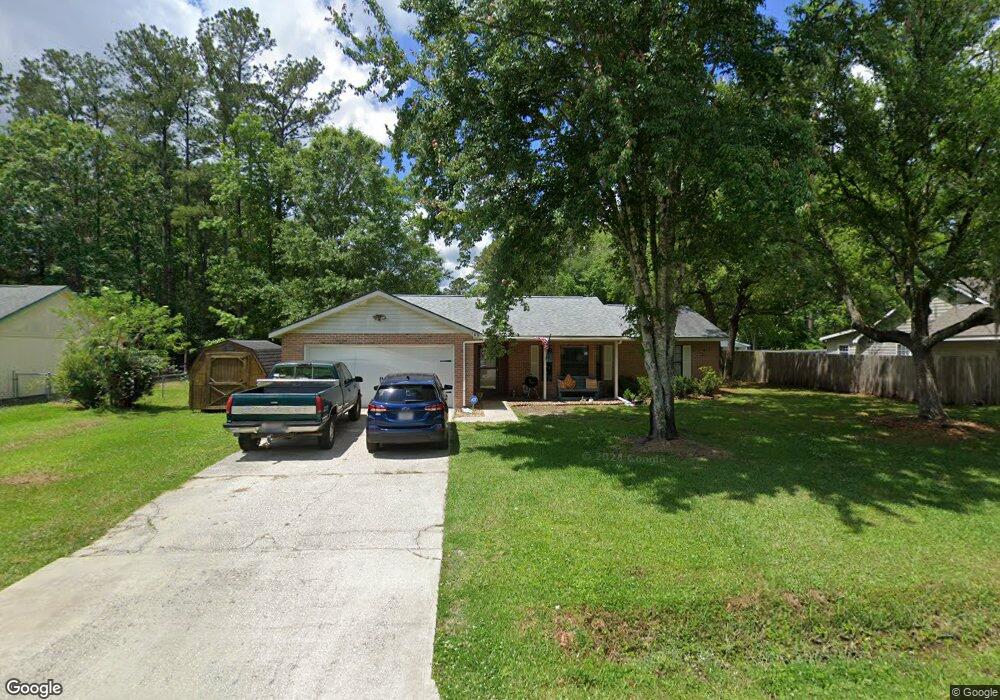
109 Woodbridge Rd Kingsland, GA 31548
Estimated Value: $230,000 - $252,000
3
Beds
2
Baths
1,138
Sq Ft
$215/Sq Ft
Est. Value
About This Home
This home is located at 109 Woodbridge Rd, Kingsland, GA 31548 and is currently estimated at $244,803, approximately $215 per square foot. 109 Woodbridge Rd is a home located in Camden County with nearby schools including Kingsland Elementary School, Camden Middle School, and Camden County High School.
Ownership History
Date
Name
Owned For
Owner Type
Purchase Details
Closed on
Dec 2, 2020
Sold by
Aligood Brian J
Bought by
Omillian Jonathan Paul
Current Estimated Value
Home Financials for this Owner
Home Financials are based on the most recent Mortgage that was taken out on this home.
Original Mortgage
$168,795
Outstanding Balance
$150,278
Interest Rate
2.7%
Mortgage Type
VA
Estimated Equity
$94,525
Purchase Details
Closed on
Sep 15, 2017
Sold by
Anderson Ashley M
Bought by
Aligood Ashley M and Allgood Brian J
Home Financials for this Owner
Home Financials are based on the most recent Mortgage that was taken out on this home.
Original Mortgage
$98,000
Interest Rate
3.89%
Mortgage Type
New Conventional
Purchase Details
Closed on
Apr 21, 2008
Sold by
Rawl Evelyn Kaminer
Bought by
Anderson Ashley M
Home Financials for this Owner
Home Financials are based on the most recent Mortgage that was taken out on this home.
Original Mortgage
$109,610
Interest Rate
5.84%
Mortgage Type
FHA
Create a Home Valuation Report for This Property
The Home Valuation Report is an in-depth analysis detailing your home's value as well as a comparison with similar homes in the area
Home Values in the Area
Average Home Value in this Area
Purchase History
| Date | Buyer | Sale Price | Title Company |
|---|---|---|---|
| Omillian Jonathan Paul | $165,000 | -- | |
| Aligood Ashley M | -- | -- | |
| Anderson Ashley M | $113,000 | -- |
Source: Public Records
Mortgage History
| Date | Status | Borrower | Loan Amount |
|---|---|---|---|
| Open | Omillian Jonathan Paul | $168,795 | |
| Previous Owner | Aligood Ashley M | $98,000 | |
| Previous Owner | Anderson Ashley M | $109,610 |
Source: Public Records
Tax History Compared to Growth
Tax History
| Year | Tax Paid | Tax Assessment Tax Assessment Total Assessment is a certain percentage of the fair market value that is determined by local assessors to be the total taxable value of land and additions on the property. | Land | Improvement |
|---|---|---|---|---|
| 2024 | $3,050 | $88,446 | $10,000 | $78,446 |
| 2023 | $3,038 | $84,721 | $10,000 | $74,721 |
| 2022 | $2,574 | $72,005 | $10,000 | $62,005 |
| 2021 | $1,928 | $62,355 | $10,000 | $52,355 |
| 2020 | $1,522 | $46,883 | $10,000 | $36,883 |
| 2019 | $1,522 | $46,883 | $10,000 | $36,883 |
| 2018 | $382 | $46,883 | $10,000 | $36,883 |
| 2017 | $1,450 | $39,402 | $6,000 | $33,402 |
| 2016 | $1,032 | $38,470 | $6,000 | $32,470 |
| 2015 | $1,307 | $38,470 | $6,000 | $32,470 |
| 2014 | $1,362 | $40,070 | $7,600 | $32,470 |
Source: Public Records
Map
Nearby Homes
- 145 W Woodhaven Dr
- 135 W Woodhaven Dr
- 208 Foxwood Dr
- 114 Pineneedle Ct
- 213 Merriwood Cir
- 231 Hide Away Lake Dr
- 240 Hide Away Lake Dr
- 213 Grassmere St
- 508 Hide-A-way Lake Loop
- 524 Hide Away Lake Loop
- 524 Hide-A-way Lake Loop
- 522 Hide-A-way Lake Loop
- 0 V L W S Henrietta-3 Acres St Unit 1652107
- 572 Henrietta St
- 233 S Sheffield St
- 232 Woodbridge Rd
- 0 W S Henrietta St
- 164 Huntington Dr
- 166 Verano St
- V/L 2 Freebird Estates Clarks Bluff Rd
- 111 Woodbridge Rd
- 126 Crestwood Ct
- 112 Woodbridge Rd
- 124 Crestwood Ct
- 113 Woodbridge Rd
- 108 Woodbridge Rd
- 103 Crestwood Ct
- 114 Woodbridge Rd
- 122 Crestwood Ct
- 105 Crestwood Ct
- 106 Woodbridge Rd
- 101 Woodbridge Rd
- 116 Woodbridge Rd
- 104 Woodbridge Rd
- 0 Crestwood Ct Unit LOT 61 7640162
- 0 Crestwood Ct Unit 3096016
- 0 Crestwood Ct Unit 2582817
- 0 Crestwood Ct Unit 8076386
- 0 Crestwood Ct Unit 8708177
- 0 Crestwood Ct Unit 7536889