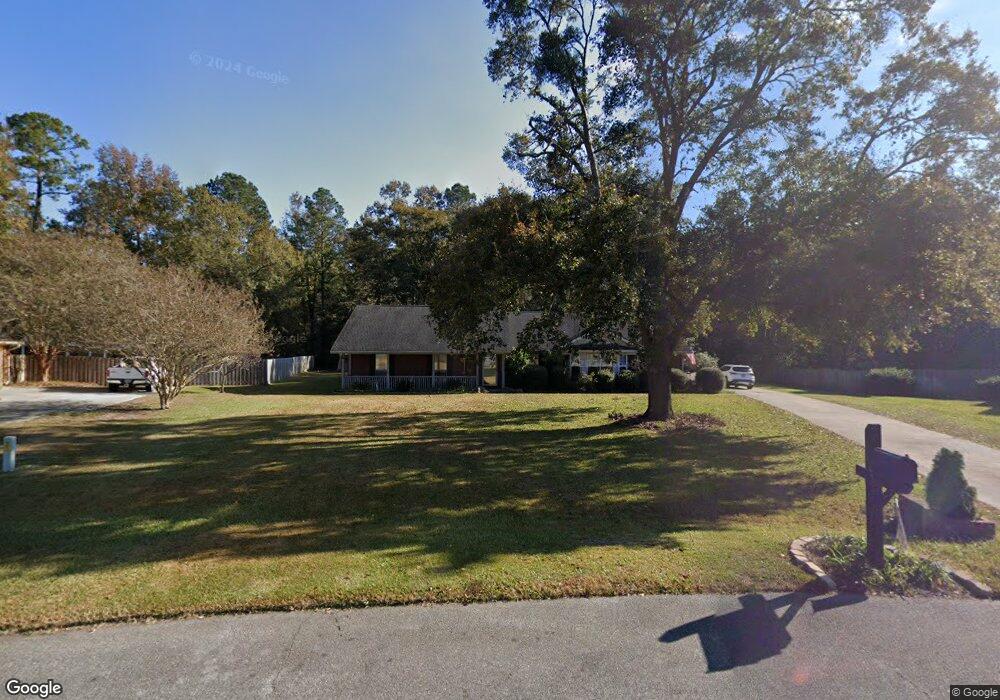
109 Woodpecker Trail Guyton, GA 31312
Estimated Value: $346,755 - $405,000
3
Beds
2
Baths
2,465
Sq Ft
$151/Sq Ft
Est. Value
About This Home
This home is located at 109 Woodpecker Trail, Guyton, GA 31312 and is currently estimated at $372,189, approximately $150 per square foot. 109 Woodpecker Trail is a home located in Effingham County with nearby schools including South Effingham Elementary School, South Effingham Middle School, and South Effingham High School.
Ownership History
Date
Name
Owned For
Owner Type
Purchase Details
Closed on
Sep 30, 2009
Sold by
Federal Home Loan Mortgage Corporation
Bought by
Edwards Guerry S and Edwards Leigh Ann
Current Estimated Value
Home Financials for this Owner
Home Financials are based on the most recent Mortgage that was taken out on this home.
Original Mortgage
$169,866
Outstanding Balance
$109,391
Interest Rate
5.05%
Mortgage Type
FHA
Estimated Equity
$262,798
Purchase Details
Closed on
Nov 4, 2008
Sold by
Gmac Mortgage Llc
Bought by
Federal Home Loan Mortgage Corporation
Purchase Details
Closed on
Dec 12, 2006
Sold by
Myrkle Gene
Bought by
Myrkle Gene and Myrkle Nichole Kathryn
Home Financials for this Owner
Home Financials are based on the most recent Mortgage that was taken out on this home.
Original Mortgage
$209,625
Interest Rate
6.19%
Mortgage Type
New Conventional
Create a Home Valuation Report for This Property
The Home Valuation Report is an in-depth analysis detailing your home's value as well as a comparison with similar homes in the area
Home Values in the Area
Average Home Value in this Area
Purchase History
| Date | Buyer | Sale Price | Title Company |
|---|---|---|---|
| Edwards Guerry S | $173,000 | -- | |
| Federal Home Loan Mortgage Corporation | $214,362 | -- | |
| Gmac Mortgage Llc | $214,362 | -- | |
| Myrkle Gene | -- | -- | |
| Myrkle Gene | $279,500 | -- |
Source: Public Records
Mortgage History
| Date | Status | Borrower | Loan Amount |
|---|---|---|---|
| Open | Edwards Guerry S | $169,866 | |
| Previous Owner | Myrkle Gene | $209,625 | |
| Previous Owner | Myrkle Gene | $69,875 |
Source: Public Records
Tax History Compared to Growth
Tax History
| Year | Tax Paid | Tax Assessment Tax Assessment Total Assessment is a certain percentage of the fair market value that is determined by local assessors to be the total taxable value of land and additions on the property. | Land | Improvement |
|---|---|---|---|---|
| 2025 | $2,813 | $106,227 | $22,800 | $83,427 |
| 2024 | $2,813 | $104,118 | $22,800 | $81,318 |
| 2023 | $1,884 | $92,822 | $18,800 | $74,022 |
| 2022 | $2,354 | $92,822 | $18,800 | $74,022 |
| 2021 | $2,531 | $96,734 | $18,000 | $78,734 |
| 2020 | $2,456 | $76,914 | $18,000 | $58,914 |
| 2019 | $2,513 | $79,459 | $18,000 | $61,459 |
| 2018 | $2,435 | $74,760 | $18,000 | $56,760 |
| 2017 | $2,316 | $70,098 | $18,000 | $52,098 |
| 2016 | $2,325 | $76,931 | $24,000 | $52,931 |
| 2015 | -- | $76,632 | $24,000 | $52,632 |
| 2014 | -- | $74,632 | $22,000 | $52,632 |
| 2013 | -- | $74,632 | $22,000 | $52,632 |
Source: Public Records
Map
Nearby Homes
- 460 Kolic Helmey Rd
- 106 Saddle Ln
- 259 Zettler Loop
- 310 Keen Way
- 203 Orchard Dr
- 103 Brindlewood Dr
- 257 Cypress Creek Ln
- 118 Red Maple Ln
- 102 Winnai Ln
- 0 Hodgeville Rd Unit SA341541
- 0 Hodgeville Rd Unit 10622997
- 172 Green Paddock Cir
- 2410 Hodgeville Rd
- 201 Antigua Place
- 217 Cypress Creek Ln
- 154 Clover Point Cir
- 158 Clover Point Cir
- 137 Saddleclub Way
- 116 Bluegrass Cir
- 162 Saddleclub Way
- 107 Woodpecker Trail
- 111 Woodpecker Trail
- 108 Woodpecker Trail
- 113 Woodpecker Trail
- 106 Woodpecker Trail
- 103 Woodpecker Trail
- 115 Woodpecker Trail
- 107 Cardinal Rd
- 104 Woodpecker Trail
- 491 Kolic Helmey Rd
- 105 Cardinal Rd
- 101 Woodpecker Trail
- 117 Woodpecker Trail
- 102 Woodpecker Trail
- 103 Cardinal Rd
- 119 Woodpecker Trail
- 110 Cardinal Rd
- 108 Cardinal Rd
- 101 Cardinal Rd
- 0-B Blue Jay