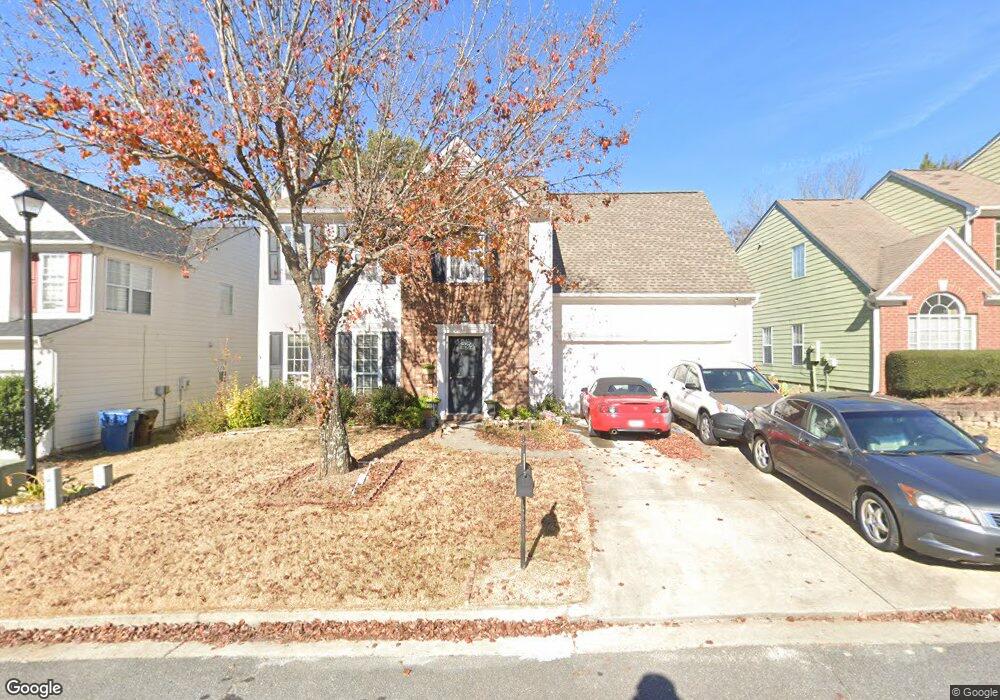
1090 Winthrope Chase Dr Alpharetta, GA 30009
Estimated Value: $519,000 - $548,000
4
Beds
3
Baths
1,828
Sq Ft
$291/Sq Ft
Est. Value
About This Home
This home is located at 1090 Winthrope Chase Dr, Alpharetta, GA 30009 and is currently estimated at $532,751, approximately $291 per square foot. 1090 Winthrope Chase Dr is a home located in Fulton County with nearby schools including Manning Oaks Elementary School, Hopewell Middle School, and Alpharetta High School.
Ownership History
Date
Name
Owned For
Owner Type
Purchase Details
Closed on
Aug 30, 2005
Sold by
Balyan Dharam S
Bought by
Balyan Dharam S and Balyan Savita
Current Estimated Value
Home Financials for this Owner
Home Financials are based on the most recent Mortgage that was taken out on this home.
Original Mortgage
$168,000
Interest Rate
5.71%
Mortgage Type
New Conventional
Purchase Details
Closed on
Aug 10, 2001
Sold by
Doyle Donald C and Doyle Tiann R
Bought by
Sandor David R
Home Financials for this Owner
Home Financials are based on the most recent Mortgage that was taken out on this home.
Original Mortgage
$179,254
Interest Rate
7.18%
Mortgage Type
FHA
Purchase Details
Closed on
Nov 28, 1997
Sold by
D R Horton Inc & Torrey
Bought by
Doyle Don
Home Financials for this Owner
Home Financials are based on the most recent Mortgage that was taken out on this home.
Original Mortgage
$128,150
Interest Rate
6.87%
Mortgage Type
New Conventional
Create a Home Valuation Report for This Property
The Home Valuation Report is an in-depth analysis detailing your home's value as well as a comparison with similar homes in the area
Home Values in the Area
Average Home Value in this Area
Purchase History
| Date | Buyer | Sale Price | Title Company |
|---|---|---|---|
| Balyan Dharam S | -- | -- | |
| Balyan Dharam S | $210,000 | -- | |
| Sandor David R | $185,400 | -- | |
| Doyle Don | $134,900 | -- |
Source: Public Records
Mortgage History
| Date | Status | Borrower | Loan Amount |
|---|---|---|---|
| Closed | Balyan Dharam S | $168,000 | |
| Previous Owner | Sandor David R | $179,254 | |
| Previous Owner | Doyle Don | $128,150 |
Source: Public Records
Tax History Compared to Growth
Tax History
| Year | Tax Paid | Tax Assessment Tax Assessment Total Assessment is a certain percentage of the fair market value that is determined by local assessors to be the total taxable value of land and additions on the property. | Land | Improvement |
|---|---|---|---|---|
| 2025 | -- | $206,840 | $53,320 | $153,520 |
| 2023 | $4,926 | $174,520 | $46,200 | $128,320 |
| 2022 | $2,184 | $137,320 | $29,480 | $107,840 |
| 2021 | $2,172 | $125,120 | $24,040 | $101,080 |
| 2020 | $2,187 | $105,760 | $24,720 | $81,040 |
| 2019 | $0 | $103,880 | $24,280 | $79,600 |
| 2018 | $2,431 | $101,480 | $23,720 | $77,760 |
| 2017 | $2,046 | $82,080 | $16,120 | $65,960 |
| 2016 | $2,045 | $82,080 | $16,120 | $65,960 |
| 2015 | $2,325 | $82,080 | $16,120 | $65,960 |
| 2014 | $2,097 | $81,160 | $15,800 | $65,360 |
Source: Public Records
Map
Nearby Homes
- 110 Jayne Ellen Ct
- 1045 Winthrope Chase Dr
- 220 Water Oak Place
- 247 Water Oak Place
- 320 Jayne Ellen Way Unit 3
- 2644 Vintage Dr
- 2632 Vintage Dr Unit 9
- 5185 N Somerset Ln
- 1050 Essex Ct
- 126 Brindle Ln
- 1085 Pine Grove Dr
- 5091 N Somerset Ln
- 225 Jayne Ellen Way
- 4821 Devon Ln
- 2535 Cogburn Ridge Rd
- 175 Jayne Ellen Way
- 12890 Cogburn Rd
- 115 Baxley Ln
- 1080 Winthrope Chase Dr
- 1100 Winthrope Chase Dr
- 0 Winthrope Chase Dr Unit 8295049
- 0 Winthrope Chase Dr Unit 3237301
- 0 Winthrope Chase Dr Unit 8308856
- 0 Winthrope Chase Dr Unit 8522903
- 0 Winthrope Chase Dr Unit 8417694
- 0 Winthrope Chase Dr Unit 8276396
- 0 Winthrope Chase Dr Unit 8083540
- 0 Winthrope Chase Dr Unit 7562136
- 0 Winthrope Chase Dr Unit 7212870
- 0 Winthrope Chase Dr Unit 8180979
- 0 Winthrope Chase Dr Unit 8796075
- 0 Winthrope Chase Dr Unit 3121925
- 0 Winthrope Chase Dr Unit 3156042
- 0 Winthrope Chase Dr Unit 3193290
- 0 Winthrope Chase Dr Unit 3266123
- 0 Winthrope Chase Dr Unit 7171481
- 0 Winthrope Chase Dr Unit 7297808
- 0 Winthrope Chase Dr Unit 7350814