Estimated Value: $294,000 - $366,000
3
Beds
3
Baths
2,860
Sq Ft
$115/Sq Ft
Est. Value
About This Home
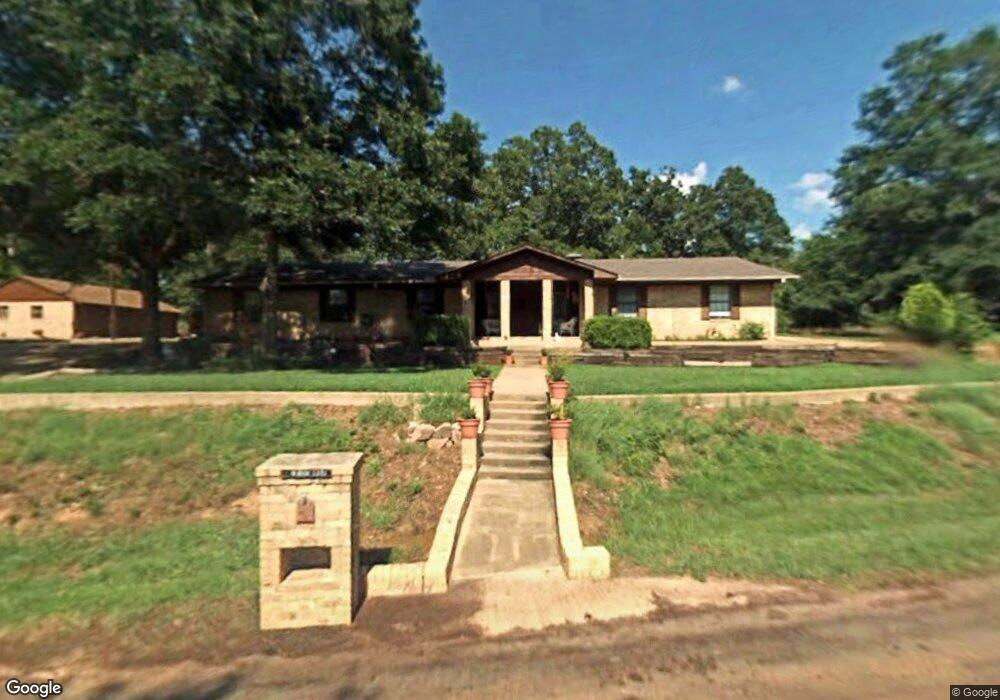
This home is located at 10901 County Road 2273, Tyler, TX 75707 and is currently estimated at $329,008, approximately $115 per square foot. 10901 County Road 2273 is a home located in Smith County with nearby schools including Kissam Intermediate School, Jackson Elementary School, and Chapel Hill Middle School.
Create a Home Valuation Report for This Property
The Home Valuation Report is an in-depth analysis detailing your home's value as well as a comparison with similar homes in the area
Home Values in the Area
Average Home Value in this Area
Tax History Compared to Growth
Tax History
| Year | Tax Paid | Tax Assessment Tax Assessment Total Assessment is a certain percentage of the fair market value that is determined by local assessors to be the total taxable value of land and additions on the property. | Land | Improvement |
|---|---|---|---|---|
| 2025 | $3,730 | $210,041 | $24,125 | $185,916 |
| 2024 | $3,730 | $216,030 | $30,000 | $186,030 |
| 2023 | $4,982 | $291,686 | $30,000 | $261,686 |
| 2022 | $4,159 | $260,131 | $30,000 | $230,131 |
| 2021 | $3,205 | $188,082 | $25,000 | $163,082 |
| 2020 | $3,339 | $188,082 | $25,000 | $163,082 |
| 2019 | $66 | $170,700 | $25,000 | $145,700 |
| 2018 | $2,852 | $154,605 | $25,000 | $129,605 |
| 2017 | $2,462 | $132,755 | $3,150 | $129,605 |
| 2016 | $2,398 | $129,318 | $3,150 | $126,168 |
| 2015 | $2,238 | $124,136 | $3,150 | $120,986 |
| 2014 | $2,238 | $120,365 | $3,150 | $117,215 |
Source: Public Records
Map
Nearby Homes
- 13310 White Tail Dr
- 13311 White Tail Dr
- 13311 White Tail Dr Unit 1
- 13332 White Tail Dr
- 10789 County Road 214
- 10680 County Road 214
- 11452 County Road 2326
- 9961 Creek Bend Dr
- 13807 County Road 220
- 13800 County Road 220
- 13594 State Highway 64 E
- 7789 Lakeshore Dr
- 10788 County Road 225
- 0000 State Highway 64
- 10908 & 10914 County Road 225
- 00 County Road 2209
- 14951 County Road 2205
- 3515 Chapel View
- 3507 Chapel View
- 3515 & 3507 Chapel View
- 10926 County Road 2250
- 10926 10926 Cr 2250 Kirkwood
- 10896 County Road 2250
- 10941 County Road 2273
- 10970 County Road 2250
- 10848 County Road 2250
- 10774 County Road 2273
- 10838 County Road 2273
- 10921 County Road 2250
- 10943 County Road 2250
- 10891 County Road 2250
- 10830 County Road 2250
- 10973 County Road 2250
- 10861 County Road 2250
- 10978 County Road 2250
- 10829 County Road 2250
- 10815 County Road 2250
- 10773 County Road 2273
- 10793 County Road 2250
- 10747 County Road 2273