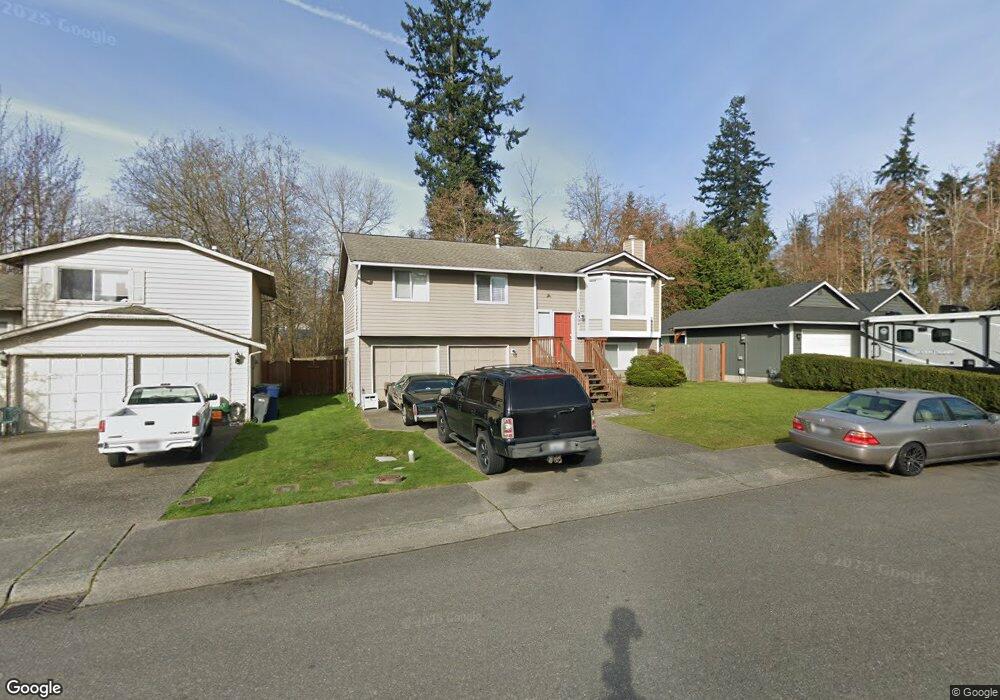
10904 17th Place W Everett, WA 98204
Holly NeighborhoodEstimated Value: $620,453 - $675,000
3
Beds
3
Baths
1,572
Sq Ft
$409/Sq Ft
Est. Value
About This Home
This home is located at 10904 17th Place W, Everett, WA 98204 and is currently estimated at $642,863, approximately $408 per square foot. 10904 17th Place W is a home located in Snohomish County with nearby schools including Fairmount Elementary School, Explorer Middle School, and Mariner High School.
Ownership History
Date
Name
Owned For
Owner Type
Purchase Details
Closed on
Apr 1, 2016
Sold by
Tran Tri and Nguyen Hoan Thi
Bought by
Ih6 Property Washington Lp
Current Estimated Value
Purchase Details
Closed on
Feb 16, 2007
Sold by
Carnes Elliott W and Carnes Constance R
Bought by
Tran Tri and Nguyen Hoan Thi
Home Financials for this Owner
Home Financials are based on the most recent Mortgage that was taken out on this home.
Original Mortgage
$62,000
Interest Rate
6.21%
Mortgage Type
Stand Alone Second
Purchase Details
Closed on
Feb 18, 1997
Sold by
Olson Keith R and Olson Maria N
Bought by
Carnes Elliot W and Carnes Constance R
Home Financials for this Owner
Home Financials are based on the most recent Mortgage that was taken out on this home.
Original Mortgage
$149,182
Interest Rate
7.85%
Mortgage Type
FHA
Create a Home Valuation Report for This Property
The Home Valuation Report is an in-depth analysis detailing your home's value as well as a comparison with similar homes in the area
Home Values in the Area
Average Home Value in this Area
Purchase History
| Date | Buyer | Sale Price | Title Company |
|---|---|---|---|
| Ih6 Property Washington Lp | $277,000 | Fidelity National Title | |
| Tran Tri | $310,000 | Rainier Title | |
| Carnes Elliot W | $151,950 | -- |
Source: Public Records
Mortgage History
| Date | Status | Borrower | Loan Amount |
|---|---|---|---|
| Previous Owner | Tran Tri | $62,000 | |
| Previous Owner | Tran Tri | $248,000 | |
| Previous Owner | Carnes Elliot W | $149,182 |
Source: Public Records
Tax History
| Year | Tax Paid | Tax Assessment Tax Assessment Total Assessment is a certain percentage of the fair market value that is determined by local assessors to be the total taxable value of land and additions on the property. | Land | Improvement |
|---|---|---|---|---|
| 2025 | $4,153 | $568,700 | $360,000 | $208,700 |
| 2024 | $4,153 | $535,700 | $327,000 | $208,700 |
| 2023 | $4,570 | $604,800 | $340,000 | $264,800 |
| 2022 | $4,021 | $461,000 | $248,000 | $213,000 |
| 2020 | $3,276 | $377,300 | $203,000 | $174,300 |
| 2019 | $2,922 | $340,800 | $172,000 | $168,800 |
| 2018 | $3,067 | $308,100 | $157,000 | $151,100 |
| 2017 | $2,581 | $265,200 | $135,000 | $130,200 |
| 2016 | $2,380 | $242,200 | $120,000 | $122,200 |
Source: Public Records
Map
Nearby Homes
- 1807 112th St SW
- 10726 20th Place W
- 2006 112th St SW
- 10425 Holly Dr
- 11527 Highway 99 Unit A105
- 11527 Highway 99 Unit B103
- 11527 Highway 99 Unit A304
- 10000 23rd Ave W
- 1131 115th St SW Unit J3
- 1131 115th St SW Unit I4
- 11517 Marino Ave Unit A
- 11517 Marino Ave Unit B
- 11626 Admiralty Way Unit A
- 2101 Center Rd
- 13428 Highway 99
- 14000 Center Rd
- 24 XX Center Rd
- 729 112th St SW Unit G-1
- 730 112th St SW Unit I4
- 2312 117th Place SW
- 10902 17th Place W
- 10908 17th Place W
- 10830 17th Place W
- 10833 17th Place W
- 19 XX Hollow Dale Place
- 10909 17th Place W
- 1714 Hollow Dale Place
- 1710 Hollow Dale Place
- 10827 17th Place W
- 10915 17th Place W
- 1623 Hollow Dale Place
- 10920 17th Place W
- 10823 17th Place W
- 1823 Hollow Dale Place
- 10921 17th Place W
- 1827 Hollow Dale Place
- 10930 17th Place W
- 1621 Hollow Dale Place
- 1620 Hollow Dale Place
- 10824 17th Place W
Your Personal Tour Guide
Ask me questions while you tour the home.