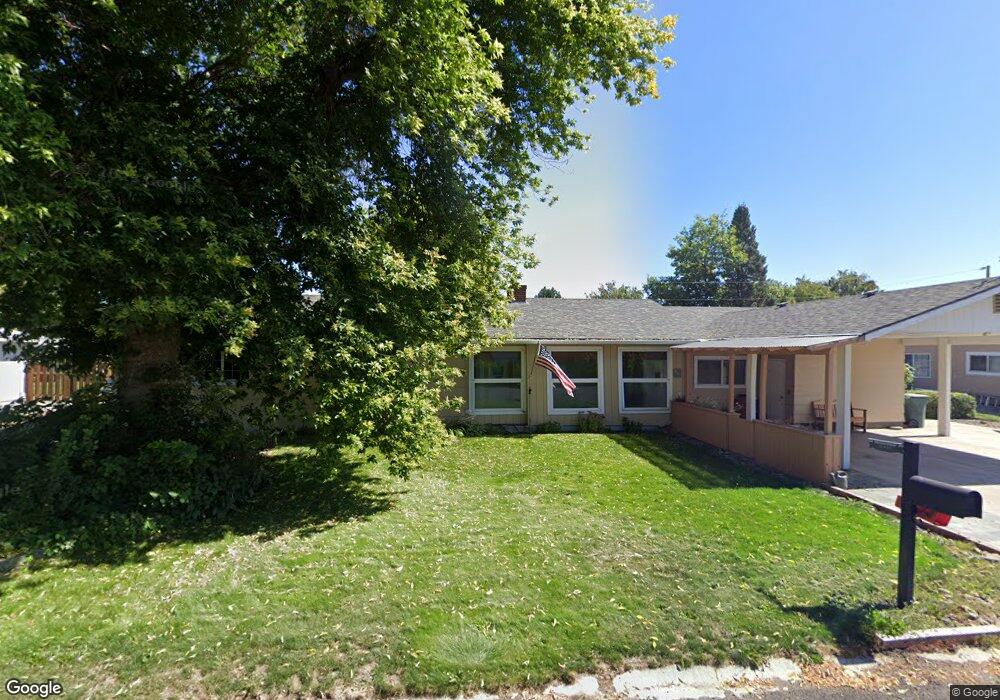
10905 S E St La Grande, OR 97850
Estimated Value: $363,850 - $405,000
3
Beds
2
Baths
1,852
Sq Ft
$208/Sq Ft
Est. Value
About This Home
This home is located at 10905 S E St, La Grande, OR 97850 and is currently estimated at $384,425, approximately $207 per square foot. 10905 S E St is a home located in Union County with nearby schools including La Grande High School, The Marian Academy, and Lighthouse Apostolic Academy.
Ownership History
Date
Name
Owned For
Owner Type
Purchase Details
Closed on
Oct 10, 2019
Sold by
Roe Preston
Bought by
Roe Preston and Roe Lilly
Current Estimated Value
Home Financials for this Owner
Home Financials are based on the most recent Mortgage that was taken out on this home.
Original Mortgage
$165,478
Outstanding Balance
$109,177
Interest Rate
3.4%
Mortgage Type
New Conventional
Estimated Equity
$275,248
Purchase Details
Closed on
Sep 16, 2013
Sold by
Savage Lonnie L and Savage Rebecca L
Bought by
Roe Preston
Home Financials for this Owner
Home Financials are based on the most recent Mortgage that was taken out on this home.
Original Mortgage
$181,649
Interest Rate
4.4%
Mortgage Type
FHA
Purchase Details
Closed on
Mar 14, 2005
Sold by
Winters Helen L and Potter Helen L
Bought by
Savage Lonnie L and Savage Rebecca L
Home Financials for this Owner
Home Financials are based on the most recent Mortgage that was taken out on this home.
Original Mortgage
$150,818
Interest Rate
5.61%
Mortgage Type
VA
Create a Home Valuation Report for This Property
The Home Valuation Report is an in-depth analysis detailing your home's value as well as a comparison with similar homes in the area
Home Values in the Area
Average Home Value in this Area
Purchase History
| Date | Buyer | Sale Price | Title Company |
|---|---|---|---|
| Roe Preston | -- | Servicelink | |
| Roe Preston | $185,000 | Eastern Oregon Title Inc | |
| Savage Lonnie L | $146,000 | Abstract & Title Company |
Source: Public Records
Mortgage History
| Date | Status | Borrower | Loan Amount |
|---|---|---|---|
| Open | Roe Preston | $165,478 | |
| Closed | Roe Preston | $181,649 | |
| Previous Owner | Savage Lonnie L | $150,818 |
Source: Public Records
Tax History Compared to Growth
Tax History
| Year | Tax Paid | Tax Assessment Tax Assessment Total Assessment is a certain percentage of the fair market value that is determined by local assessors to be the total taxable value of land and additions on the property. | Land | Improvement |
|---|---|---|---|---|
| 2025 | $2,891 | $214,090 | $59,770 | $154,320 |
| 2024 | $2,787 | $207,860 | $58,030 | $149,830 |
| 2023 | $2,749 | $201,810 | $56,340 | $145,470 |
| 2022 | $2,678 | $195,943 | $54,699 | $141,244 |
| 2021 | $2,613 | $190,236 | $53,219 | $137,017 |
| 2020 | $2,498 | $184,696 | $51,702 | $132,994 |
| 2019 | $2,453 | $179,317 | $50,279 | $129,038 |
| 2018 | $2,391 | $174,095 | $48,828 | $125,267 |
| 2017 | $2,323 | $169,025 | $47,497 | $121,528 |
| 2016 | $2,253 | $164,102 | $34,523 | $129,579 |
| 2015 | $2,166 | $159,323 | $33,527 | $125,796 |
| 2014 | $1,807 | $154,683 | $32,551 | $122,132 |
| 2013 | -- | $150,178 | $31,565 | $118,613 |
Source: Public Records
Map
Nearby Homes
- 10907 Kristin Way
- 10913 Kristin Way
- 10601 Jeff Ln
- 10603 Greg Ln
- 10605 Greg Ln
- 10701 Greg Ln
- 10703 Greg Ln
- 10604 Greg Ln
- 10804 Carrie Way
- 10807 Carrie Way
- 10808 Carrie Way
- 10806 Carrie Way
- 10504 G Ct
- 0 Mcalister Rd
- 0 Walton Rd Unit 546563801
- 1705 E Glacier St
- 1809 26th St Unit 21
- 1809 26th St
- 1809 26th St Unit 12
- 10203 S Mcalister Rd
- 10907 S E St
- 10903 S E St
- 10303 Center Ave
- 10304 Center Ave
- 10904 S E St
- 10906 S E St
- 10307 Emily Dr
- 10302 Mount Fanny Ave
- 10906 S D St
- 10902 S D St
- 10303 Emily Dr Unit 5
- 10908 S E St
- 10900 S E St
- 10300 Mount Fanny Ave
- 10301 Emily Dr
- 10909 Kristin Way Unit 37
- 10909 Kristin Way
- 10905 Kristin Way
- 10911 Kristin Way