10909 Corey Ln NE Poulsbo, WA 98370
Estimated Value: $376,000 - $502,473
2
Beds
1
Bath
960
Sq Ft
$470/Sq Ft
Est. Value
About This Home
This home is located at 10909 Corey Ln NE, Poulsbo, WA 98370 and is currently estimated at $451,118, approximately $469 per square foot. 10909 Corey Ln NE is a home located in Kitsap County with nearby schools including Brownsville Elementary School, Ridgetop Middle School, and Olympic High School.
Ownership History
Date
Name
Owned For
Owner Type
Purchase Details
Closed on
Jan 4, 2021
Sold by
Russell Kathleen A
Bought by
Horan Amy Beth Yvonne and Horan James M
Current Estimated Value
Purchase Details
Closed on
Jun 18, 2007
Sold by
Wayman Terry Francis
Bought by
Russell Kathleen A
Home Financials for this Owner
Home Financials are based on the most recent Mortgage that was taken out on this home.
Original Mortgage
$160,800
Interest Rate
7.25%
Mortgage Type
Negative Amortization
Purchase Details
Closed on
Apr 18, 2001
Sold by
Klabo Anona Martina
Bought by
Wayman Terry Francis
Home Financials for this Owner
Home Financials are based on the most recent Mortgage that was taken out on this home.
Original Mortgage
$90,000
Interest Rate
6.98%
Create a Home Valuation Report for This Property
The Home Valuation Report is an in-depth analysis detailing your home's value as well as a comparison with similar homes in the area
Home Values in the Area
Average Home Value in this Area
Purchase History
| Date | Buyer | Sale Price | Title Company |
|---|---|---|---|
| Horan Amy Beth Yvonne | $111,069 | None Available | |
| Russell Kathleen A | $201,280 | First American Title Ins Co | |
| Wayman Terry Francis | $118,000 | Land Title Company |
Source: Public Records
Mortgage History
| Date | Status | Borrower | Loan Amount |
|---|---|---|---|
| Previous Owner | Russell Kathleen A | $160,800 | |
| Previous Owner | Wayman Terry Francis | $90,000 |
Source: Public Records
Tax History Compared to Growth
Tax History
| Year | Tax Paid | Tax Assessment Tax Assessment Total Assessment is a certain percentage of the fair market value that is determined by local assessors to be the total taxable value of land and additions on the property. | Land | Improvement |
|---|---|---|---|---|
| 2026 | $3,552 | $372,930 | $133,260 | $239,670 |
| 2025 | $3,552 | $372,930 | $133,260 | $239,670 |
| 2024 | $3,087 | $331,610 | $133,650 | $197,960 |
| 2023 | $3,097 | $331,610 | $133,650 | $197,960 |
| 2022 | $2,883 | $271,590 | $111,380 | $160,210 |
| 2021 | $2,732 | $244,740 | $99,790 | $144,950 |
| 2020 | $2,589 | $234,670 | $95,340 | $139,330 |
| 2019 | $2,511 | $220,400 | $89,100 | $131,300 |
| 2018 | $2,445 | $169,380 | $74,250 | $95,130 |
| 2017 | $2,215 | $169,380 | $74,250 | $95,130 |
| 2016 | $2,265 | $160,480 | $74,250 | $86,230 |
| 2015 | $2,170 | $160,480 | $74,250 | $86,230 |
| 2014 | -- | $156,330 | $74,250 | $82,080 |
| 2013 | -- | $156,330 | $74,250 | $82,080 |
Source: Public Records
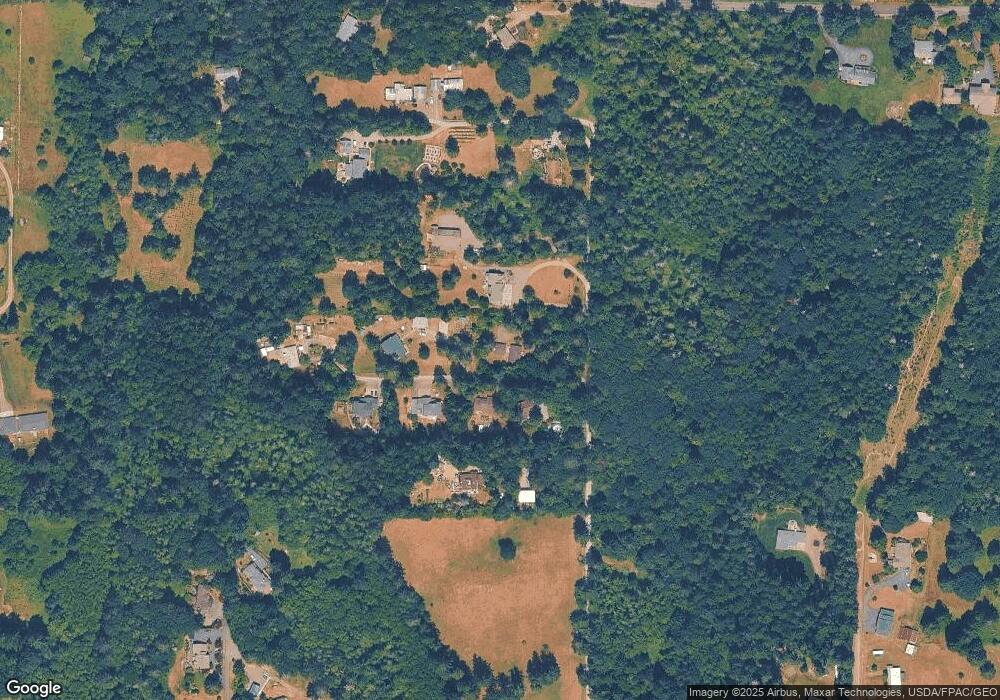
Map
Nearby Homes
- 135 Walker Rd NW
- 0 NW Sigurd Hanson Rd Unit NWM2446171
- 10155 Royal Valley Rd NE
- 10825 Brownsville Hwy NE
- 305 NE Waaga Way
- 9406 Saint Johns Place NE
- 0 xxxx Brownsville Hwy NE
- 12620 Old Military Rd NE
- 981 NW Highgarden Dr
- 12161 S Keyport Rd NE
- 981 Mahogany Ln NW
- 8971 Watson Place NE
- 10211 Ramble Dr NW
- 563 NW Silver Glen Ln
- 12391 S Keyport Rd NE
- 8811 Overlook Circle Dr NE Unit 71
- 241 NE Watson Ct
- 1995 Sipes Ln NE
- 1135 NW Windy Beach Ln
- 2120 NE Edwin Ct
- 10853 Corey Ln NE
- 10949 Corey Ln NE
- 10865 Corey Ln NE
- 10903 Corey Ln NE
- 10877 Corey Ln NE
- 10833 Corey Ln NE
- 11045 Corey Ln NE
- 10889 Corey Ln NE
- 0 XXX Corey Ln NE
- 0 Corey Ln NE
- 10917 Corey Ln NE
- 11073 Corey Ln NE
- 11205 Old Military Rd NE
- 622 NE Paulson Rd
- 11233 Old Military Rd NE
- 10705 Kelly Ct NE
- 11101 Corey Ln NE
- 616 NE Paulson Rd
- 10722 Kelly Ct NE
- 971 NE Madison Rd