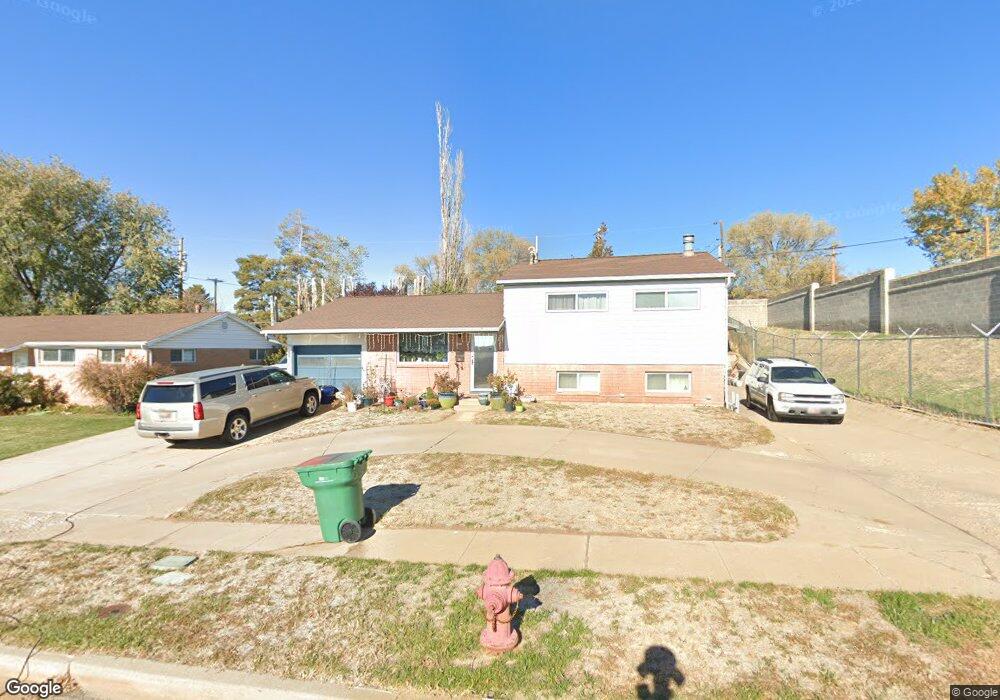
1091 E 225 S Clearfield, UT 84015
Estimated Value: $414,000 - $434,000
5
Beds
3
Baths
2,136
Sq Ft
$199/Sq Ft
Est. Value
About This Home
Property Id: 1643606
Charming 5 bed 2.5 bath home freshly painted with new carpet, new blinds, & new garage door! Located on a quiet road close to Hill Air Force Base. Large shed in the back to store all your tools, extra household items, small vehicles, etc. Long driveway with plenty of off-street parking.
No pets, no smoking.
Ownership History
Date
Name
Owned For
Owner Type
Purchase Details
Closed on
Aug 2, 2024
Sold by
Rowland Natasha and Rowland Scan
Bought by
Martinez-Parry Jacob
Current Estimated Value
Home Financials for this Owner
Home Financials are based on the most recent Mortgage that was taken out on this home.
Original Mortgage
$337,500
Outstanding Balance
$333,375
Interest Rate
6.87%
Mortgage Type
Seller Take Back
Estimated Equity
$92,047
Purchase Details
Closed on
May 31, 2023
Sold by
White Family Revocable Trust
Bought by
Rowland Natasha and Rowland Sean
Home Financials for this Owner
Home Financials are based on the most recent Mortgage that was taken out on this home.
Original Mortgage
$337,500
Interest Rate
6.39%
Mortgage Type
New Conventional
Purchase Details
Closed on
Oct 31, 2022
Sold by
White Eric P
Bought by
Grant Hereby
Create a Home Valuation Report for This Property
The Home Valuation Report is an in-depth analysis detailing your home's value as well as a comparison with similar homes in the area
Home Values in the Area
Average Home Value in this Area
Purchase History
| Date | Buyer | Sale Price | Title Company |
|---|---|---|---|
| Martinez-Parry Jacob | -- | Real Advantage Title | |
| Rowland Natasha | -- | Intermountain Title | |
| Grant Hereby | -- | Intermountain Title |
Source: Public Records
Mortgage History
| Date | Status | Borrower | Loan Amount |
|---|---|---|---|
| Open | Martinez-Parry Jacob | $337,500 | |
| Previous Owner | Rowland Natasha | $337,500 |
Source: Public Records
Property History
| Date | Event | Price | List to Sale | Price per Sq Ft |
|---|---|---|---|---|
| 12/03/2024 12/03/24 | Off Market | $2,190 | -- | -- |
| 11/21/2024 11/21/24 | For Rent | $2,190 | -- | -- |
Tax History Compared to Growth
Tax History
| Year | Tax Paid | Tax Assessment Tax Assessment Total Assessment is a certain percentage of the fair market value that is determined by local assessors to be the total taxable value of land and additions on the property. | Land | Improvement |
|---|---|---|---|---|
| 2025 | $2,395 | $413,000 | $139,393 | $273,607 |
| 2024 | $2,395 | $216,149 | $73,263 | $142,886 |
| 2023 | $2,209 | $201,300 | $64,238 | $137,061 |
| 2022 | $779 | $211,750 | $66,569 | $145,181 |
| 2021 | $514 | $280,000 | $72,922 | $207,078 |
| 2020 | $13 | $224,000 | $61,753 | $162,247 |
| 2019 | $1,402 | $220,000 | $63,159 | $156,841 |
| 2018 | $0 | $195,000 | $53,257 | $141,743 |
| 2016 | $1,215 | $82,170 | $22,543 | $59,627 |
| 2015 | $1,136 | $73,260 | $22,543 | $50,717 |
| 2014 | $1,044 | $68,205 | $22,543 | $45,662 |
| 2013 | $998 | $62,320 | $20,039 | $42,281 |
Source: Public Records
Map
Nearby Homes