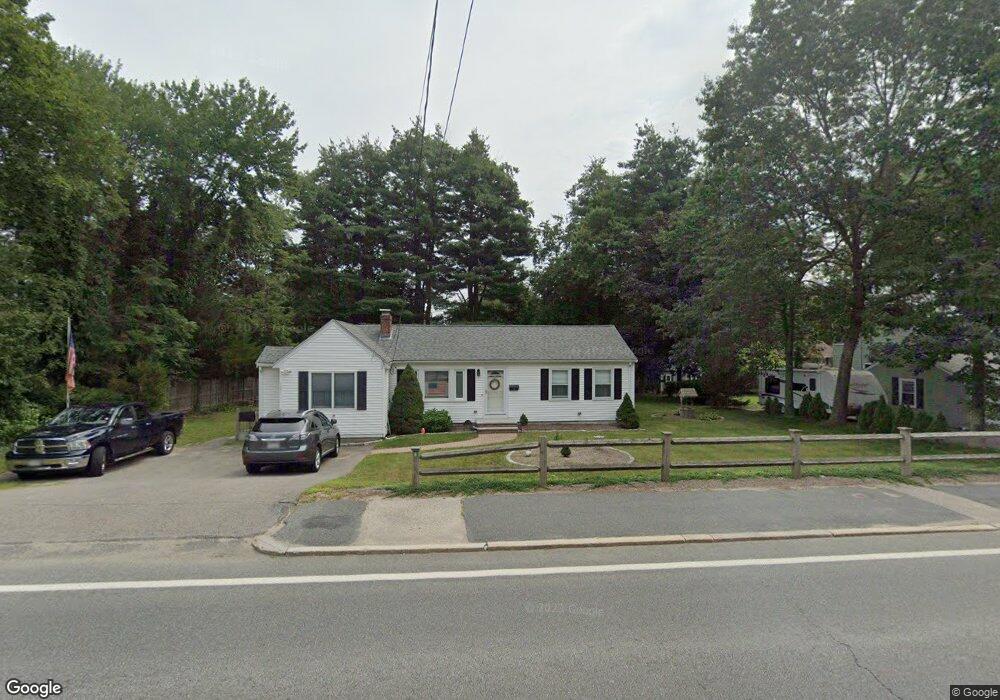
1091 Edgell Rd Framingham, MA 01701
Nobscot NeighborhoodEstimated Value: $590,000 - $656,000
3
Beds
2
Baths
1,480
Sq Ft
$424/Sq Ft
Est. Value
About This Home
This home is located at 1091 Edgell Rd, Framingham, MA 01701 and is currently estimated at $626,813, approximately $423 per square foot. 1091 Edgell Rd is a home located in Middlesex County with nearby schools including Framingham High School, MetroWest Jewish Day School, and Sudbury Valley School.
Ownership History
Date
Name
Owned For
Owner Type
Purchase Details
Closed on
Aug 7, 2024
Sold by
Kelley Paul L and Kelley Sandra C
Bought by
Paul L Kelley T L and Paul Kelley
Current Estimated Value
Purchase Details
Closed on
Sep 26, 1975
Bought by
Kelley Paul and Kelley Sandra C
Create a Home Valuation Report for This Property
The Home Valuation Report is an in-depth analysis detailing your home's value as well as a comparison with similar homes in the area
Home Values in the Area
Average Home Value in this Area
Purchase History
| Date | Buyer | Sale Price | Title Company |
|---|---|---|---|
| Paul L Kelley T L | -- | None Available | |
| Paul L Kelley T L | -- | None Available | |
| Paul L Kelley T L | -- | None Available | |
| Kelley Paul | -- | -- |
Source: Public Records
Mortgage History
| Date | Status | Borrower | Loan Amount |
|---|---|---|---|
| Previous Owner | Kelley Paul | $40,000 | |
| Previous Owner | Kelley Paul | $113,500 | |
| Previous Owner | Kelley Paul | $28,000 | |
| Previous Owner | Kelley Paul | $85,000 |
Source: Public Records
Tax History
| Year | Tax Paid | Tax Assessment Tax Assessment Total Assessment is a certain percentage of the fair market value that is determined by local assessors to be the total taxable value of land and additions on the property. | Land | Improvement |
|---|---|---|---|---|
| 2025 | $6,520 | $546,100 | $264,400 | $281,700 |
| 2024 | $6,295 | $505,200 | $236,100 | $269,100 |
| 2023 | $5,957 | $455,100 | $210,800 | $244,300 |
| 2022 | $5,625 | $409,400 | $191,300 | $218,100 |
| 2021 | $5,463 | $388,800 | $183,800 | $205,000 |
| 2020 | $5,489 | $366,400 | $167,100 | $199,300 |
| 2019 | $5,397 | $350,900 | $167,100 | $183,800 |
| 2018 | $5,328 | $326,500 | $160,800 | $165,700 |
| 2017 | $5,132 | $307,100 | $156,100 | $151,000 |
| 2016 | $5,032 | $289,500 | $156,100 | $133,400 |
| 2015 | $4,999 | $280,500 | $156,400 | $124,100 |
Source: Public Records
Map
Nearby Homes
- 106 Baldwin Ave
- 301 Windsor Dr
- 907 Windsor Dr
- 1224 Edgell Rd
- 2 Hemenway Rd
- 2 Chesterfield St
- 19 Nob Hill Dr
- 32 Eaton Rd W
- 44 Agnes Dr
- 10 Rolling Ln
- 19 Rolling Ln
- 32 Lyman Rd
- 28 Garvey Rd
- 472 Potter Rd
- 6 Mountain View Dr
- 620 Edmands Rd
- 4 Tartufi Cir
- 1060 Grove St Unit 31
- 1060 Grove St Unit 23
- 1060 Grove St Unit 43
Your Personal Tour Guide
Ask me questions while you tour the home.