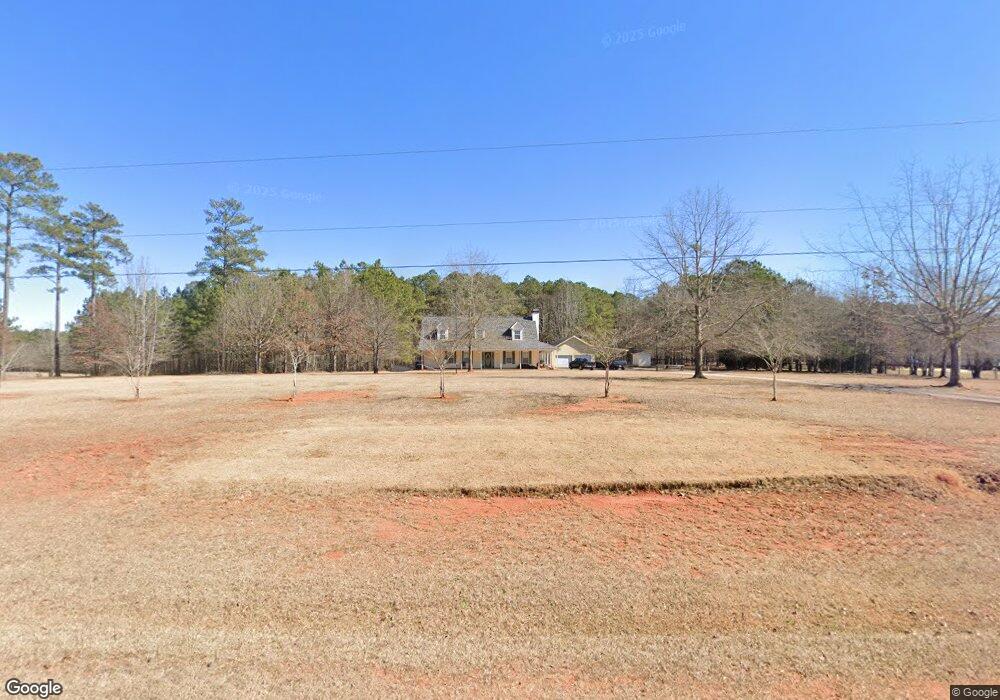
1091 Sewell Ln Mansfield, GA 30055
Estimated Value: $355,000 - $563,126
3
Beds
3
Baths
2,184
Sq Ft
$217/Sq Ft
Est. Value
About This Home
This home is located at 1091 Sewell Ln, Mansfield, GA 30055 and is currently estimated at $474,282, approximately $217 per square foot. 1091 Sewell Ln is a home located in Morgan County with nearby schools including Morgan County Primary School, Morgan County Elementary School, and Morgan County Middle School.
Ownership History
Date
Name
Owned For
Owner Type
Purchase Details
Closed on
Oct 22, 2007
Sold by
Palmer Keith J
Bought by
Hsbc Mtg Svcs
Current Estimated Value
Home Financials for this Owner
Home Financials are based on the most recent Mortgage that was taken out on this home.
Original Mortgage
$197,910
Outstanding Balance
$122,786
Interest Rate
6.27%
Mortgage Type
New Conventional
Estimated Equity
$351,496
Purchase Details
Closed on
Aug 9, 2004
Sold by
Palmer Keith Jeffrey
Bought by
Palmer Keith J
Purchase Details
Closed on
Mar 3, 2004
Sold by
Palmer Keith Jeffrey
Bought by
Palmer Keith Jeffrey
Purchase Details
Closed on
Sep 29, 2003
Sold by
Palmer Linda L
Bought by
Palmer Keith Jeffrey
Purchase Details
Closed on
May 16, 2003
Sold by
Palmer Jack W
Bought by
Palmer Linda L
Purchase Details
Closed on
Oct 14, 1999
Sold by
Weyerhaeuser Real Es
Bought by
Palmer Jack W
Purchase Details
Closed on
Feb 17, 1999
Bought by
Weyerhaeuser Real Es
Create a Home Valuation Report for This Property
The Home Valuation Report is an in-depth analysis detailing your home's value as well as a comparison with similar homes in the area
Home Values in the Area
Average Home Value in this Area
Purchase History
| Date | Buyer | Sale Price | Title Company |
|---|---|---|---|
| Hsbc Mtg Svcs | $269,875 | -- | |
| Henry Jesse | $219,900 | -- | |
| Palmer Keith J | -- | -- | |
| Palmer Keith Jeffrey | -- | -- | |
| Palmer Keith Jeffrey | -- | -- | |
| Palmer Linda L | -- | -- | |
| Palmer Jack W | $33,400 | -- | |
| Weyerhaeuser Real Es | -- | -- |
Source: Public Records
Mortgage History
| Date | Status | Borrower | Loan Amount |
|---|---|---|---|
| Open | Henry Jesse | $197,910 | |
| Closed | Hsbc Mtg Svcs | $197,910 |
Source: Public Records
Tax History Compared to Growth
Tax History
| Year | Tax Paid | Tax Assessment Tax Assessment Total Assessment is a certain percentage of the fair market value that is determined by local assessors to be the total taxable value of land and additions on the property. | Land | Improvement |
|---|---|---|---|---|
| 2025 | $3,475 | $186,342 | $51,788 | $134,554 |
| 2024 | $3,500 | $155,632 | $46,034 | $109,598 |
| 2023 | $3,226 | $139,269 | $40,280 | $98,989 |
| 2022 | $2,808 | $116,776 | $25,180 | $91,596 |
| 2021 | $2,749 | $113,939 | $22,561 | $91,378 |
| 2020 | $2,752 | $113,005 | $22,561 | $90,444 |
| 2019 | $2,797 | $113,005 | $22,561 | $90,444 |
| 2018 | $2,838 | $113,005 | $22,561 | $90,444 |
| 2017 | $2,775 | $107,131 | $22,561 | $84,570 |
| 2016 | $2,432 | $93,930 | $20,890 | $73,040 |
| 2015 | $2,501 | $95,320 | $19,680 | $75,640 |
| 2014 | $2,303 | $90,360 | $17,080 | $73,280 |
| 2013 | -- | $68,320 | $22,880 | $45,440 |
Source: Public Records
Map
Nearby Homes
- 1060 Sewell Church Rd
- 35 Mattie Ct
- 1297 Hodges Cir
- 5761 Hancock Dr
- 857 Cooper Rd
- 1202 Hodges Cir
- 925 Cooper Rd
- 225 Ewing Dr
- 220 Nicklaus Cir
- 175 Ewing Dr
- 1581 Hodges Cir
- 995 Hodges Cir
- 5841 Atlanta Hwy
- 5432 Willow Wind Ct
- 145 Fiddle Creek Unit 12
- 10 Nicklaus Cir
- 1500 Pine Forest Rd
- 45 Fiddle Creek
- 5521 Atlanta Hwy
- 180 Cooper Rd
- 1061 Sewell Ln
- 1161 Sewell Ln
- 1121 Sewell Ln
- 1031 Sewell Ln
- 1161 Sewell Ln
- 1001 Sewell Ln
- 1181 Sewell Ln
- 1201 Sewell Ln Unit 8
- 1201 Sewell Ln
- 1221 Sewell Ln
- 1491 Sewell Church Rd
- 1681 Sewell Rd
- 1431 Sewell Church Rd
- 1020 Estes Rd Unit 10ac
- 1020 Estes Rd
- 0 Estes Rd Unit Lot 8 8290747
- 0 Estes Rd Unit 66700
- 0 Estes Rd Unit 1019529
- 0 Estes Rd Unit 10344639
- 1030 Estes Rd