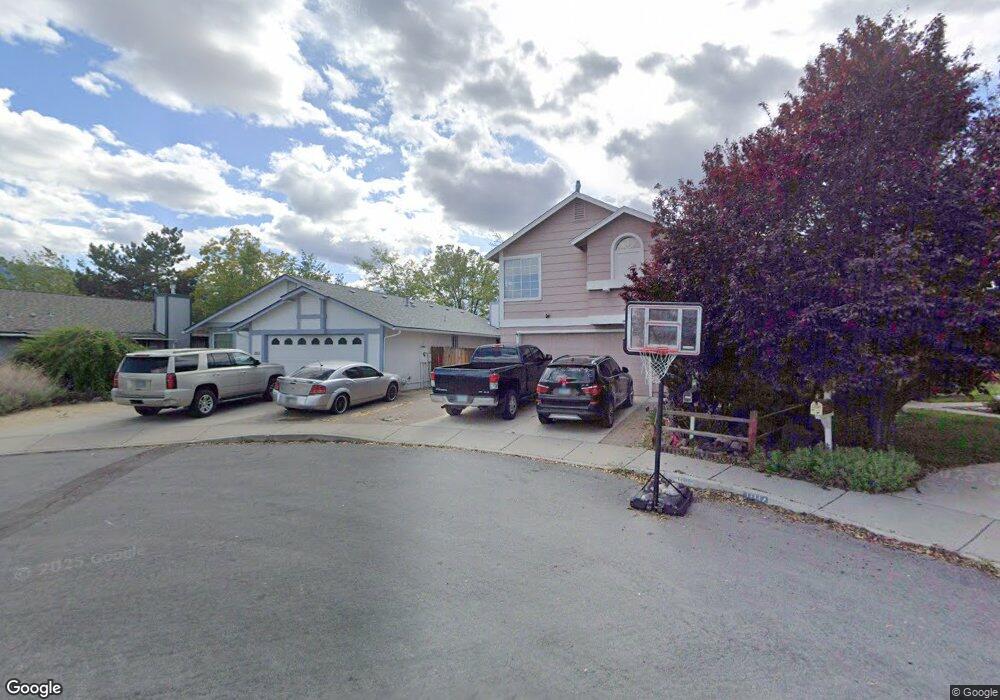
1091 Shadelands Ct Reno, NV 89523
Mae Anne Avenue NeighborhoodEstimated Value: $483,770 - $511,000
3
Beds
2
Baths
1,270
Sq Ft
$393/Sq Ft
Est. Value
About This Home
This home is located at 1091 Shadelands Ct, Reno, NV 89523 and is currently estimated at $499,193, approximately $393 per square foot. 1091 Shadelands Ct is a home located in Washoe County with nearby schools including B D Billinghurst Middle School, Robert McQueen High School, and Riverview Christian Academy.
Ownership History
Date
Name
Owned For
Owner Type
Purchase Details
Closed on
Dec 13, 2013
Sold by
Deutsche Bank National Trust Co
Bought by
Housing Authority Of The City Of Reno
Current Estimated Value
Purchase Details
Closed on
Oct 30, 2013
Sold by
Dominique Andrew and Dominique Jennifer
Bought by
Deutsche Bank National Trust Co and Morgan Stanley Abs Capital I Inc Trust 2
Purchase Details
Closed on
Nov 30, 2004
Sold by
Luzier Bonni L
Bought by
Dominique Andrew and Dominique Jennifer
Home Financials for this Owner
Home Financials are based on the most recent Mortgage that was taken out on this home.
Original Mortgage
$224,000
Interest Rate
6.25%
Mortgage Type
Unknown
Purchase Details
Closed on
Jun 24, 1994
Sold by
Mcgah Dutton and Mcgah Bailey
Bought by
Luzier Bonni L
Home Financials for this Owner
Home Financials are based on the most recent Mortgage that was taken out on this home.
Original Mortgage
$115,150
Interest Rate
8.83%
Create a Home Valuation Report for This Property
The Home Valuation Report is an in-depth analysis detailing your home's value as well as a comparison with similar homes in the area
Home Values in the Area
Average Home Value in this Area
Purchase History
| Date | Buyer | Sale Price | Title Company |
|---|---|---|---|
| Housing Authority Of The City Of Reno | -- | None Available | |
| Deutsche Bank National Trust Co | $192,000 | Lsi Title Agency Inc | |
| Dominique Andrew | $280,000 | Western Title Incorporated | |
| Luzier Bonni L | $128,000 | Stewart Title |
Source: Public Records
Mortgage History
| Date | Status | Borrower | Loan Amount |
|---|---|---|---|
| Previous Owner | Dominique Andrew | $224,000 | |
| Previous Owner | Luzier Bonni L | $115,150 | |
| Closed | Dominique Andrew | $56,000 |
Source: Public Records
Tax History Compared to Growth
Tax History
| Year | Tax Paid | Tax Assessment Tax Assessment Total Assessment is a certain percentage of the fair market value that is determined by local assessors to be the total taxable value of land and additions on the property. | Land | Improvement |
|---|---|---|---|---|
| 2025 | $4 | $85,677 | $39,340 | $46,337 |
| 2024 | $4 | $82,485 | $35,595 | $46,890 |
| 2023 | $4 | $82,130 | $37,520 | $44,610 |
| 2022 | $3 | $68,994 | $31,605 | $37,389 |
| 2021 | $4 | $59,100 | $21,735 | $37,365 |
| 2020 | $3 | $58,480 | $20,895 | $37,585 |
| 2019 | $4 | $57,175 | $20,755 | $36,420 |
| 2018 | $4 | $50,842 | $15,085 | $35,757 |
| 2017 | $4 | $49,997 | $14,070 | $35,927 |
| 2016 | $5 | $49,565 | $12,670 | $36,895 |
| 2015 | $4 | $47,858 | $11,095 | $36,763 |
| 2014 | $0 | $45,572 | $9,975 | $35,597 |
| 2013 | -- | $42,447 | $7,245 | $35,202 |
Source: Public Records
Map
Nearby Homes
- 6338 Chesterfield Ln
- 6339 Park Place
- 1031 Ambassador Dr
- 6357 Moon Ridge Terrace
- 6440 Enchanted Valley Dr
- 6850 Sharlands Ave Unit V2128
- 6850 Sharlands Ave Unit T 2113
- 6850 Sharlands Ave Unit Q1095
- 6850 Sharlands Ave Unit 1111
- 6850 Sharlands Ave Unit F2030
- 6850 Sharlands Ave Unit a2003
- 6673 Enchanted Valley Dr
- 6087 White Water Way
- 1664 Shadow Wood Rd
- 1651 Ashbury Ln
- 6811 Sonterra Ln
- 1751 Glen Oaks Dr
- 1055 Udowski Unit Homesite 53
- 1025 Udowski Unit Homesite 56
- 0 Unit 250003854
- 1101 Shadelands Ct
- 1081 Shadelands Ct
- 1071 Shadelands Ct
- 6399 Chesterfield Ln
- 1120 Forest Knoll Ct
- 6395 Chesterfield Ln
- 1110 Forest Knoll Ct
- 1111 Shadelands Ct
- 1130 Forest Knoll Ct
- 1100 Forest Knoll Ct
- 1061 Shadelands Ct
- 1140 Forest Knoll Ct
- 1121 Shadelands Ct
- 1150 Forest Knoll Ct
- 1100 Shadelands Ct
- 1090 Shadelands Ct
- 1120 Shadelands Ct
- 1051 Shadelands Ct
- 1080 Shadelands Ct
- 1110 Shadelands Ct