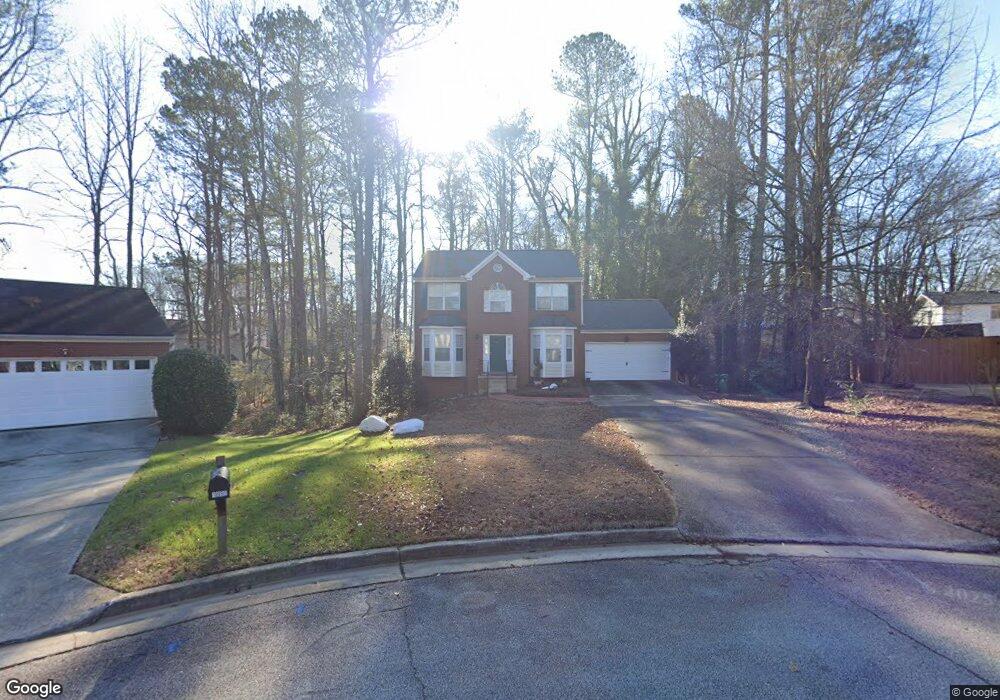
1091 Shadow Lake Dr Unit 10 Lithonia, GA 30058
Estimated Value: $283,000 - $297,000
3
Beds
4
Baths
1,882
Sq Ft
$154/Sq Ft
Est. Value
About This Home
This home is located at 1091 Shadow Lake Dr Unit 10, Lithonia, GA 30058 and is currently estimated at $289,873, approximately $154 per square foot. 1091 Shadow Lake Dr Unit 10 is a home located in DeKalb County with nearby schools including Shadow Rock Elementary School, Redan Middle School, and Redan High School.
Ownership History
Date
Name
Owned For
Owner Type
Purchase Details
Closed on
Apr 28, 2014
Sold by
Bromell Shawn A
Bought by
Herring Hawthorne B
Current Estimated Value
Home Financials for this Owner
Home Financials are based on the most recent Mortgage that was taken out on this home.
Original Mortgage
$107,000
Outstanding Balance
$81,615
Interest Rate
4.43%
Mortgage Type
VA
Estimated Equity
$208,258
Purchase Details
Closed on
Jun 6, 2001
Sold by
Jackson Don S and Jackson Venus
Bought by
Hightower Shawn
Home Financials for this Owner
Home Financials are based on the most recent Mortgage that was taken out on this home.
Original Mortgage
$142,499
Interest Rate
7.23%
Mortgage Type
New Conventional
Purchase Details
Closed on
May 31, 1996
Sold by
Homeland Communities Inc
Bought by
Jackson Donald S
Create a Home Valuation Report for This Property
The Home Valuation Report is an in-depth analysis detailing your home's value as well as a comparison with similar homes in the area
Home Values in the Area
Average Home Value in this Area
Purchase History
| Date | Buyer | Sale Price | Title Company |
|---|---|---|---|
| Herring Hawthorne B | $107,000 | -- | |
| Hightower Shawn | $150,000 | -- | |
| Jackson Donald S | $115,700 | -- |
Source: Public Records
Mortgage History
| Date | Status | Borrower | Loan Amount |
|---|---|---|---|
| Open | Herring Hawthorne B | $107,000 | |
| Previous Owner | Hightower Shawn | $142,499 | |
| Closed | Jackson Donald S | $0 |
Source: Public Records
Tax History Compared to Growth
Tax History
| Year | Tax Paid | Tax Assessment Tax Assessment Total Assessment is a certain percentage of the fair market value that is determined by local assessors to be the total taxable value of land and additions on the property. | Land | Improvement |
|---|---|---|---|---|
| 2025 | $3,246 | $119,680 | $16,000 | $103,680 |
| 2024 | $3,342 | $120,960 | $16,000 | $104,960 |
| 2023 | $3,342 | $117,960 | $16,000 | $101,960 |
| 2022 | $2,569 | $90,360 | $5,120 | $85,240 |
| 2021 | $2,120 | $70,920 | $5,120 | $65,800 |
| 2020 | $1,802 | $56,920 | $5,120 | $51,800 |
| 2019 | $1,962 | $64,600 | $5,120 | $59,480 |
| 2018 | $1,480 | $56,920 | $5,120 | $51,800 |
| 2017 | $1,733 | $52,240 | $5,120 | $47,120 |
| 2016 | $1,519 | $46,520 | $5,120 | $41,400 |
| 2014 | $2,578 | $50,000 | $5,120 | $44,880 |
Source: Public Records
Map
Nearby Homes
- 1055 Carriage Place
- 978 Shadow Ridge Trail
- 6019 Paul Rd
- 6020 Paul Rd
- 663 Lakes Cir
- 607 Shadow Valley Ct
- 1062 Valley Rock Dr
- 6274 Booker Ln
- 1426 Greenridge Trail
- 789 Rutland Ct
- 6393 Shadow Square
- 6373 Shadow Square
- 6247 Greenock Dr Unit 5
- 6220 Pattillo Way
- 1417 Doe Valley Dr
- 6150 Silver Spur Dr
- 5902 Valley Green Rd
- 579 Shadow Lake Dr
- 491 Shadow Valley Ct
- 6261 Lake Valley Point
- 1091 Shadow Lake Dr
- 1095 Shadow Lake Dr
- 1087 Shadow Lake Dr
- 1092 Peggy McMillan Dr
- 1081 King Way Dr
- 1073 King Way Dr
- 1089 King Way Dr
- 1092 Shadow Lake Dr
- 1079 Shadow Lake Dr
- 1110 Peggy McMillan Dr
- 1088 Shadow Lake Dr
- 1065 King Way Dr
- 1088 Shadow Lake Dr
- 1065 Kingsway Dr Unit 1065
- 1068 Shadow Lake Dr
- 1097 King Way Dr
- 1057 King Way Dr
- 5938 King Way Walk
- 1093 Peggy McMillan Dr
- 5915 Lakeway Glen