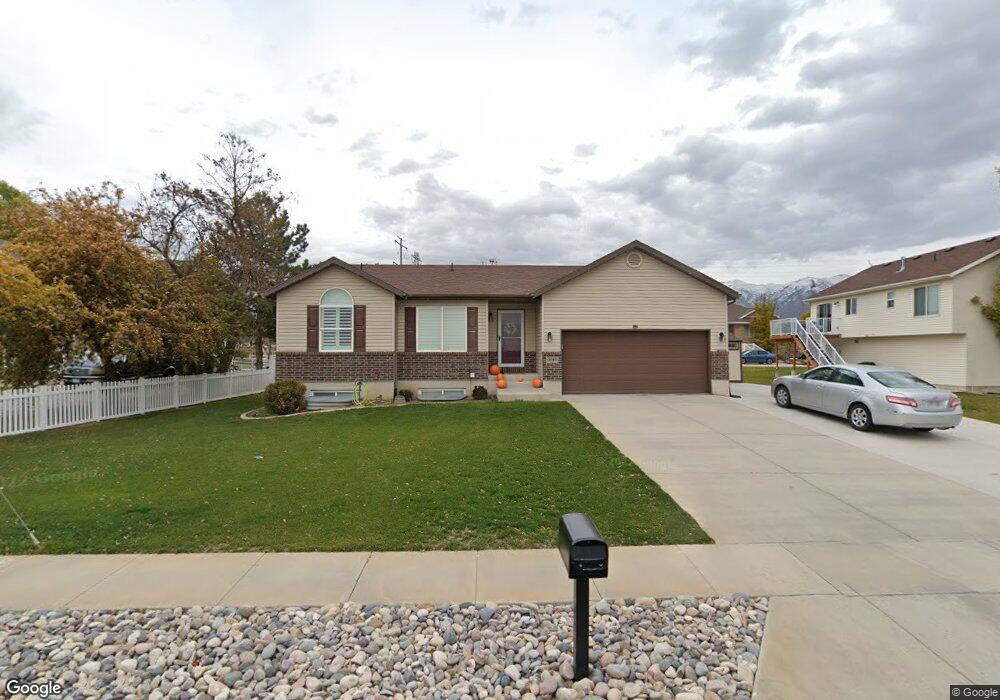
1091 Westside Dr Layton, UT 84041
Estimated Value: $529,000 - $613,000
4
Beds
2
Baths
1,342
Sq Ft
$432/Sq Ft
Est. Value
About This Home
This home is located at 1091 Westside Dr, Layton, UT 84041 and is currently estimated at $579,126, approximately $431 per square foot. 1091 Westside Dr is a home located in Davis County with nearby schools including Heritage Elementary School, Shoreline Junior High School, and Layton High School.
Ownership History
Date
Name
Owned For
Owner Type
Purchase Details
Closed on
Nov 2, 2009
Sold by
Haskell Homes Inc
Bought by
Frandsen Eric and Frandsen Lari
Current Estimated Value
Home Financials for this Owner
Home Financials are based on the most recent Mortgage that was taken out on this home.
Original Mortgage
$215,316
Outstanding Balance
$138,298
Interest Rate
5%
Mortgage Type
FHA
Estimated Equity
$440,828
Purchase Details
Closed on
Jul 2, 2009
Sold by
Iron Horse Investments Llc
Bought by
Frandsen Eric and Frandsen Lari
Home Financials for this Owner
Home Financials are based on the most recent Mortgage that was taken out on this home.
Original Mortgage
$157,400
Interest Rate
4.79%
Mortgage Type
Construction
Create a Home Valuation Report for This Property
The Home Valuation Report is an in-depth analysis detailing your home's value as well as a comparison with similar homes in the area
Home Values in the Area
Average Home Value in this Area
Purchase History
| Date | Buyer | Sale Price | Title Company |
|---|---|---|---|
| Frandsen Eric | -- | Aspen Title Insurance Age | |
| Haskell Homes Inc | -- | Aspen Title Insurance A | |
| Frandsen Eric | -- | Equity Title Ins Agency Inc |
Source: Public Records
Mortgage History
| Date | Status | Borrower | Loan Amount |
|---|---|---|---|
| Open | Frandsen Eric | $215,316 | |
| Previous Owner | Frandsen Eric | $157,400 |
Source: Public Records
Tax History
| Year | Tax Paid | Tax Assessment Tax Assessment Total Assessment is a certain percentage of the fair market value that is determined by local assessors to be the total taxable value of land and additions on the property. | Land | Improvement |
|---|---|---|---|---|
| 2025 | $2,709 | $284,350 | $119,150 | $165,200 |
| 2024 | $2,595 | $274,450 | $130,041 | $144,409 |
| 2023 | $2,506 | $467,000 | $132,225 | $334,775 |
| 2022 | $2,610 | $276,650 | $80,300 | $196,350 |
| 2021 | $2,610 | $394,000 | $120,458 | $273,542 |
| 2020 | $2,348 | $340,000 | $101,969 | $238,031 |
| 2019 | $2,320 | $329,000 | $103,173 | $225,827 |
| 2018 | $2,163 | $308,000 | $90,651 | $217,349 |
| 2016 | $1,805 | $132,550 | $36,354 | $96,196 |
| 2015 | $1,865 | $130,075 | $36,354 | $93,721 |
| 2014 | $1,796 | $128,070 | $36,354 | $91,716 |
| 2013 | -- | $110,355 | $33,983 | $76,372 |
Source: Public Records
Map
Nearby Homes
- 1124 S Neville St
- 1234 S Grace Way
- 1281 S Grace Way
- 1278 S Grace Way
- 2076 W 800 S
- 583 S Alberta Spruce Dr
- 1354 W 725 S
- 322 Tessa Creek Way Unit 429
- 621 S Sugar Pine Dr
- 1038 S Old Towne Rd
- 1048 S Old Towne Rd
- 1115 W 550 S
- 356 Apple Leaf Ave
- 2056 W Phillips St
- 2109 W 200 N
- 2397 W Harmony Dr
- 765 W Farming Way
- 2011 Hill St
- 306 S Sunburst Dr
- 263 S Sunburst Dr
- 1091 Westside Dr Unit 11
- 1728 W 1100 S
- 1079 Westside Dr
- 1115 Westside Dr
- 1712 W 1100 S
- 1065 Westside Dr
- 1117 Westside Dr
- 1688 W 1100 S Unit 7
- 1688 W 1100 S
- 1694 W 1100 S
- 1694 W 1100 S Unit 8
- 1695 W 1100 S
- 1695 W 1100 S Unit 1
- 1051 Westside Dr
- 1686 W 1100 S Unit 6
- 1686 W 1100 S
- 1683 W 1100 S Unit 2
- 1683 W 1100 S
- 1050 Westside Dr
- 1684 W 1100 S Unit 5
Your Personal Tour Guide
Ask me questions while you tour the home.