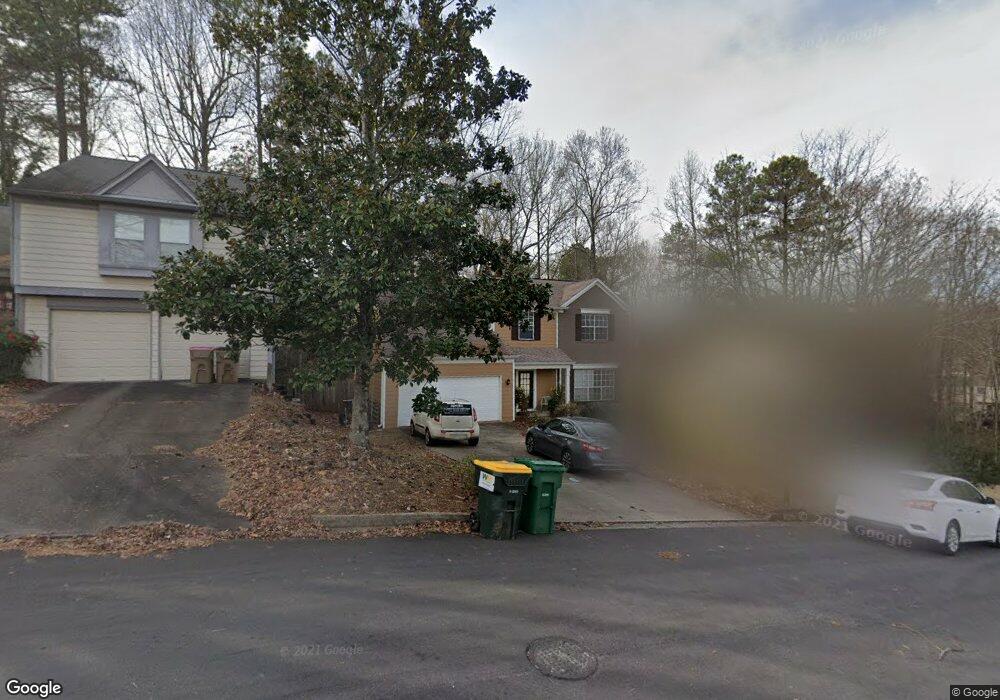
10910 Mortons Crossing Unit 1B Alpharetta, GA 30022
Estimated Value: $502,234 - $553,000
4
Beds
3
Baths
2,144
Sq Ft
$246/Sq Ft
Est. Value
About This Home
This home is located at 10910 Mortons Crossing Unit 1B, Alpharetta, GA 30022 and is currently estimated at $526,809, approximately $245 per square foot. 10910 Mortons Crossing Unit 1B is a home located in Fulton County with nearby schools including State Bridge Crossing Elementary School, Taylor Road Middle School, and Chattahoochee High School.
Ownership History
Date
Name
Owned For
Owner Type
Purchase Details
Closed on
Jan 16, 2003
Sold by
Hardin Gary W
Bought by
Duggirala Suryaji R
Current Estimated Value
Home Financials for this Owner
Home Financials are based on the most recent Mortgage that was taken out on this home.
Original Mortgage
$168,625
Outstanding Balance
$73,142
Interest Rate
6.25%
Mortgage Type
New Conventional
Estimated Equity
$453,667
Purchase Details
Closed on
Jun 5, 1997
Sold by
Kinch Montgomery L and Kinch Christine
Bought by
Hardin Gary W
Home Financials for this Owner
Home Financials are based on the most recent Mortgage that was taken out on this home.
Original Mortgage
$128,700
Interest Rate
7.92%
Mortgage Type
New Conventional
Purchase Details
Closed on
Feb 28, 1996
Sold by
Voigt Richard F Sheila M
Bought by
Kinch Montgomery L
Create a Home Valuation Report for This Property
The Home Valuation Report is an in-depth analysis detailing your home's value as well as a comparison with similar homes in the area
Home Values in the Area
Average Home Value in this Area
Purchase History
| Date | Buyer | Sale Price | Title Company |
|---|---|---|---|
| Duggirala Suryaji R | $177,500 | -- | |
| Hardin Gary W | $135,500 | -- | |
| Kinch Montgomery L | $132,000 | -- |
Source: Public Records
Mortgage History
| Date | Status | Borrower | Loan Amount |
|---|---|---|---|
| Open | Duggirala Suryaji R | $168,625 | |
| Previous Owner | Hardin Gary W | $128,700 | |
| Closed | Kinch Montgomery L | $0 |
Source: Public Records
Tax History Compared to Growth
Tax History
| Year | Tax Paid | Tax Assessment Tax Assessment Total Assessment is a certain percentage of the fair market value that is determined by local assessors to be the total taxable value of land and additions on the property. | Land | Improvement |
|---|---|---|---|---|
| 2025 | $2,588 | $224,400 | $34,920 | $189,480 |
| 2023 | $4,961 | $175,760 | $28,320 | $147,440 |
| 2022 | $2,468 | $135,080 | $29,880 | $105,200 |
| 2021 | $2,436 | $119,400 | $24,720 | $94,680 |
| 2020 | $2,449 | $117,960 | $24,400 | $93,560 |
| 2019 | $302 | $115,880 | $24,000 | $91,880 |
| 2018 | $2,626 | $98,240 | $16,760 | $81,480 |
| 2017 | $2,393 | $83,760 | $11,520 | $72,240 |
| 2016 | $2,339 | $83,760 | $11,520 | $72,240 |
| 2015 | $2,363 | $83,760 | $11,520 | $72,240 |
| 2014 | $2,040 | $70,880 | $9,760 | $61,120 |
Source: Public Records
Map
Nearby Homes
- 225 Morton Creek Cir
- 4826 Abberley Ln
- 4815 Tanners Spring Dr
- 10906 Gallier St
- 220 Magnolia Tree Ct
- 200 Boca Ciega Ct
- 5022 Anclote Dr
- 230 Pinebridge Ct
- 4965 Cinnabar Dr
- 10570 Bridgemor Dr
- 5060 Cinnabar Dr
- 465 Mikasa Dr
- 4740 Carversham Way
- 515 Avian Ct
- 750 Gates Ln
- 5425 Taylor Rd Unit 2
- 4645 Valais Ct Unit 109
- 513 Camden Hall Dr
- 130 Douglas Fir Ct Unit 1
- 10900 Mortons Crossing Unit 1B
- 10920 Mortons Crossing
- 10585 Morton Chase Way
- 10890 Mortons Crossing Unit 1B
- 10575 Morton Chase Way
- 10595 Morton Chase Way
- 4800 Streamside Dr
- 10835 Mortons Crossing
- 10880 Mortons Crossing Unit 1B
- 10565 Morton Chase Way
- 10605 Morton Chase Way
- 4810 Streamside Dr
- 10825 Mortons Crossing
- 10555 Morton Chase Way
- 10870 Mortons Crossing
- 10850 Mortons Cir
- 10615 Morton Chase Way
- 4955 Tanners Spring Dr
- 10840 Mortons Cir
- 10840 Mortons Crossin Crossing