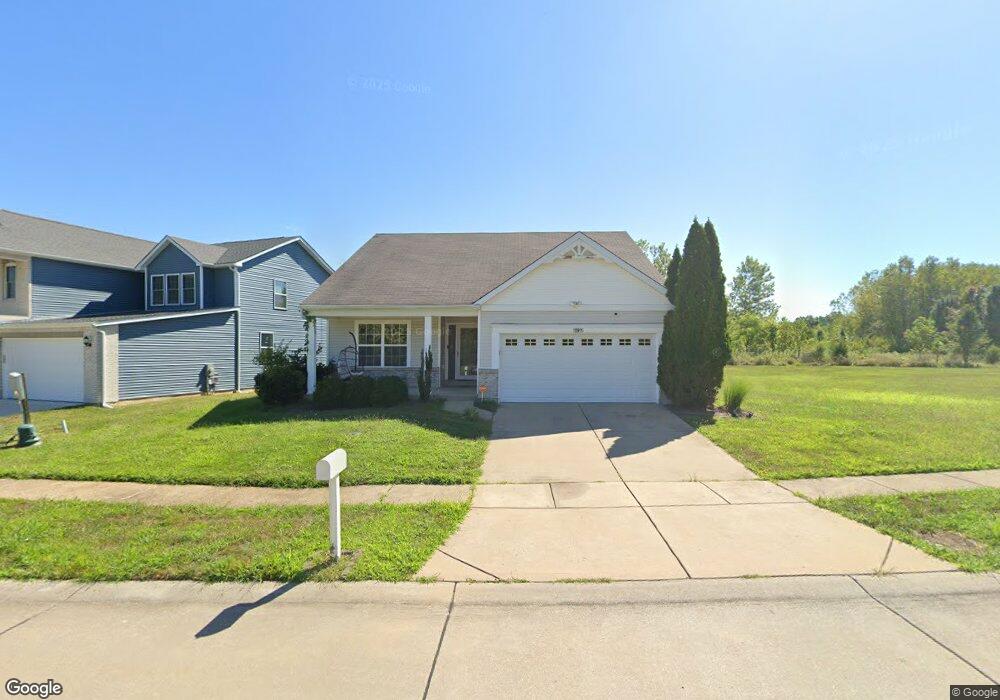
10911 Bellefontaine Estates Ct Saint Louis, MO 63137
Estimated Value: $192,334 - $212,000
2
Beds
2
Baths
1,546
Sq Ft
$130/Sq Ft
Est. Value
About This Home
This home is located at 10911 Bellefontaine Estates Ct, Saint Louis, MO 63137 and is currently estimated at $200,334, approximately $129 per square foot. 10911 Bellefontaine Estates Ct is a home located in St. Louis County with nearby schools including Riverview Gardens Senior High School and Grace Chapel Lutheran School.
Ownership History
Date
Name
Owned For
Owner Type
Purchase Details
Closed on
Aug 31, 2023
Sold by
Koerper Kyle
Bought by
Wollenberg Leann
Current Estimated Value
Purchase Details
Closed on
May 31, 2017
Sold by
Mica Development Llc
Bought by
Koerper Kyle
Home Financials for this Owner
Home Financials are based on the most recent Mortgage that was taken out on this home.
Original Mortgage
$108,007
Interest Rate
4.5%
Mortgage Type
FHA
Purchase Details
Closed on
Jan 25, 2017
Sold by
Morgan Dennis and Morgan Dennis E
Bought by
Mica Development Llc
Purchase Details
Closed on
Apr 15, 2009
Sold by
Louisville Realty Corporation
Bought by
Morgan Dennis
Home Financials for this Owner
Home Financials are based on the most recent Mortgage that was taken out on this home.
Original Mortgage
$105,061
Interest Rate
4.84%
Mortgage Type
FHA
Create a Home Valuation Report for This Property
The Home Valuation Report is an in-depth analysis detailing your home's value as well as a comparison with similar homes in the area
Home Values in the Area
Average Home Value in this Area
Purchase History
| Date | Buyer | Sale Price | Title Company |
|---|---|---|---|
| Wollenberg Leann | -- | None Listed On Document | |
| Koerper Kyle | $110,000 | Continental Title Holding Co | |
| Mica Development Llc | $67,601 | None Available | |
| Morgan Dennis | $107,000 | First American Title Ins Co |
Source: Public Records
Mortgage History
| Date | Status | Borrower | Loan Amount |
|---|---|---|---|
| Previous Owner | Koerper Kyle | $108,007 | |
| Previous Owner | Morgan Dennis | $105,061 |
Source: Public Records
Tax History Compared to Growth
Tax History
| Year | Tax Paid | Tax Assessment Tax Assessment Total Assessment is a certain percentage of the fair market value that is determined by local assessors to be the total taxable value of land and additions on the property. | Land | Improvement |
|---|---|---|---|---|
| 2025 | $3,676 | $37,750 | $2,390 | $35,360 |
| 2024 | $3,676 | $36,140 | $3,020 | $33,120 |
| 2023 | $3,624 | $36,140 | $3,020 | $33,120 |
| 2022 | $3,717 | $29,050 | $2,300 | $26,750 |
| 2021 | $3,679 | $29,050 | $2,300 | $26,750 |
| 2020 | $3,023 | $26,660 | $2,910 | $23,750 |
| 2019 | $2,930 | $26,660 | $2,910 | $23,750 |
| 2018 | $2,784 | $23,960 | $1,980 | $21,980 |
| 2017 | $2,685 | $23,960 | $1,980 | $21,980 |
| 2016 | $2,389 | $20,900 | $1,980 | $18,920 |
| 2015 | $2,319 | $20,900 | $1,980 | $18,920 |
| 2014 | $2,314 | $20,900 | $3,230 | $17,670 |
Source: Public Records
Map
Nearby Homes
- 10940 John James Dr
- 1050 Fry #B Ln
- 10617 Dunkeld Cir
- 10602 Moidart Cir
- 324 Shepley Dr
- 248 Perthshire Rd
- 329 Midlothian Rd
- 277 Roderick Dr
- 332 Banff Cir
- 252 Midlothian Rd
- 416 Midlothian Rd
- 209 Grampian Rd
- 205 Grampian Rd
- 211 Perthshire Rd
- 204 Tay Rd
- 224 Tay Rd
- 151 Brigadoon Cir
- 404 Lancashire Rd
- 437 Lancashire Rd
- 424 Lancashire Rd
- 10911 Bellefontaine Estates Ct
- 10927 Bellefontaine Estates Ct
- 10931 Bellefontaine Estates Ct
- 0 Bellefontaine Estates Ct Unit 10064867
- 0 Bellefontaine Estates Ct Unit 10064843
- 10912 Bellefontaine Estates Ct Unit 63
- 10916 Bellefontaine Estates Ct Unit 64
- 10920 Bellefontaine Estates Ct Unit 65
- 10908 Bellefontaine Estates Ct Unit 62
- 10924 Bellefontaine Estates Ct Unit 66
- 10904 Bellefontaine Estates Ct Unit 61
- 10935 Bellefontaine Estates Ct
- 10935 Bellefontaine Estates Ct Unit 4
- 10928 Bellefontaine Estates Ct Unit 67
- 10932 Bellefontaine Estates Ct
- 10932 Bellefontaine Estates Ct
- 10940 Bellefontaine Estates Ct
- 10940 Bellefontaine Estates Ct
- 10940 Bellefontaine Estates Ct
- 10939 Bellefontaine Estates Ct Unit 3