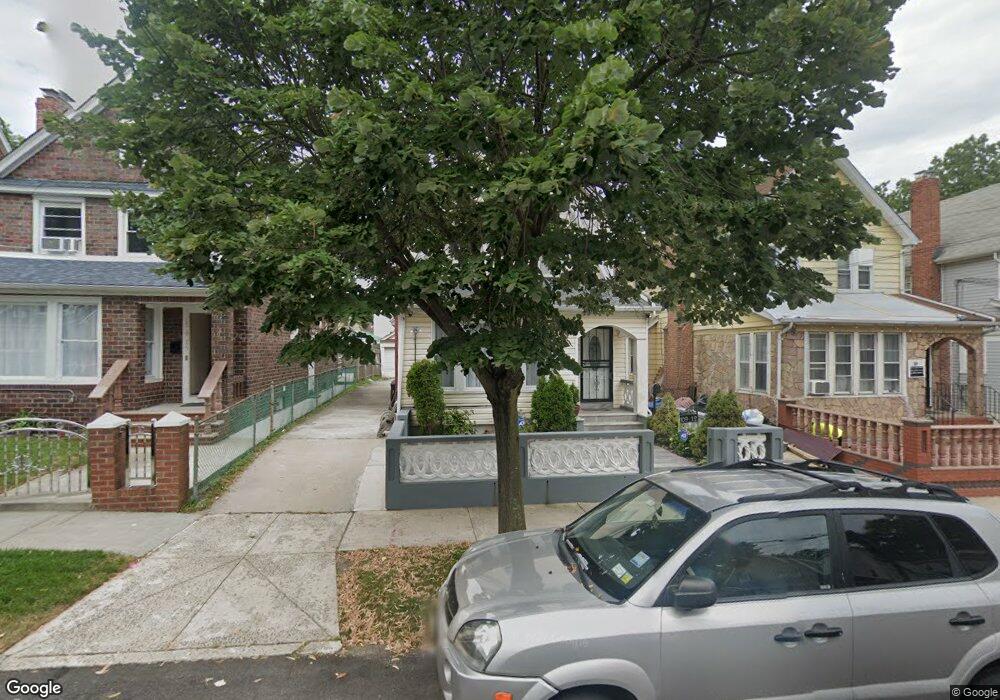
10912 200th St Saint Albans, NY 11412
Hollis NeighborhoodEstimated Value: $730,000 - $865,000
3
Beds
1
Bath
1,716
Sq Ft
$454/Sq Ft
Est. Value
About This Home
This home is located at 10912 200th St, Saint Albans, NY 11412 and is currently estimated at $779,601, approximately $454 per square foot. 10912 200th St is a home located in Queens County with nearby schools including P.S. 134 Langston Hughes School, I.S. 192 The Linden, and Wellspring Elementary & Middle.
Ownership History
Date
Name
Owned For
Owner Type
Purchase Details
Closed on
Feb 11, 2015
Sold by
Etheart Christina
Bought by
Tilokee Francilia and Tilokee Jerry
Current Estimated Value
Home Financials for this Owner
Home Financials are based on the most recent Mortgage that was taken out on this home.
Original Mortgage
$334,248
Outstanding Balance
$255,820
Interest Rate
3.74%
Mortgage Type
New Conventional
Estimated Equity
$523,781
Purchase Details
Closed on
Nov 17, 2011
Sold by
Fraser Ella Noreen and Perry Godfrey
Bought by
Etheart Christina
Home Financials for this Owner
Home Financials are based on the most recent Mortgage that was taken out on this home.
Original Mortgage
$272,902
Interest Rate
3.88%
Mortgage Type
New Conventional
Purchase Details
Closed on
Aug 11, 2006
Sold by
Begum Renuara and Nessa Fazilatun
Bought by
Saleh Salema
Purchase Details
Closed on
Nov 15, 2000
Sold by
Sophia Holding Corp
Bought by
Perry Godfrey and Fraser Ella Noreen
Home Financials for this Owner
Home Financials are based on the most recent Mortgage that was taken out on this home.
Original Mortgage
$217,209
Interest Rate
7.64%
Mortgage Type
FHA
Create a Home Valuation Report for This Property
The Home Valuation Report is an in-depth analysis detailing your home's value as well as a comparison with similar homes in the area
Home Values in the Area
Average Home Value in this Area
Purchase History
| Date | Buyer | Sale Price | Title Company |
|---|---|---|---|
| Tilokee Francilia | $365,000 | -- | |
| Etheart Christina | $280,000 | -- | |
| Saleh Salema | $125,000 | -- | |
| Perry Godfrey | $219,000 | Stewart Title |
Source: Public Records
Mortgage History
| Date | Status | Borrower | Loan Amount |
|---|---|---|---|
| Open | Tilokee Francilia | $334,248 | |
| Previous Owner | Etheart Christina | $272,902 | |
| Previous Owner | Perry Godfrey | $217,209 |
Source: Public Records
Tax History Compared to Growth
Tax History
| Year | Tax Paid | Tax Assessment Tax Assessment Total Assessment is a certain percentage of the fair market value that is determined by local assessors to be the total taxable value of land and additions on the property. | Land | Improvement |
|---|---|---|---|---|
| 2025 | $5,517 | $29,117 | $7,790 | $21,327 |
| 2024 | $5,517 | $27,469 | $8,550 | $18,919 |
| 2023 | $5,424 | $27,004 | $8,510 | $18,494 |
| 2022 | $5,086 | $34,560 | $12,120 | $22,440 |
| 2021 | $5,362 | $35,220 | $12,120 | $23,100 |
| 2020 | $5,136 | $32,760 | $12,120 | $20,640 |
| 2019 | $4,789 | $32,760 | $12,120 | $20,640 |
| 2018 | $4,587 | $22,503 | $10,402 | $12,101 |
| 2017 | $4,328 | $21,232 | $10,941 | $10,291 |
| 2016 | $4,244 | $21,232 | $10,941 | $10,291 |
| 2015 | $2,196 | $20,220 | $11,606 | $8,614 |
| 2014 | $2,196 | $19,076 | $13,126 | $5,950 |
Source: Public Records
Map
Nearby Homes
- 19920 Hollis Ave
- 200-21 Hollis Ave
- 104-39 199th St
- 10445 198th St
- 20202 109th Ave
- 104-38 202nd St
- 10411 200th St
- 104-28 201st St
- 10967 203rd St
- 100-32 199th St
- 204-06 109th Ave
- 11132 199th St
- 194-10 Hollis Ave
- 19319 109th Rd
- 204-20 104th Ave
- 19907 100th Ave
- 104-40 194th St
- 19404 110th Rd
- 193-21 109th Rd
- 99-11 200th St
- 10912 200th St
- 10916 200th St
- 10910 200th St
- 10910 200th St
- 10916 200th St
- 10906 200th St
- 10920 200th St
- 111 200th St
- 10902 200th St
- 10902 200th St Unit 2nd Fl
- 10902 200th St
- 10924 200th St
- 19910 109th Ave
- 10911 199th St
- 10915 199th St
- 10917 199th St
- 19906 109th Ave
- 10919 200th St
- 10919 200th St
- 10911 200th St