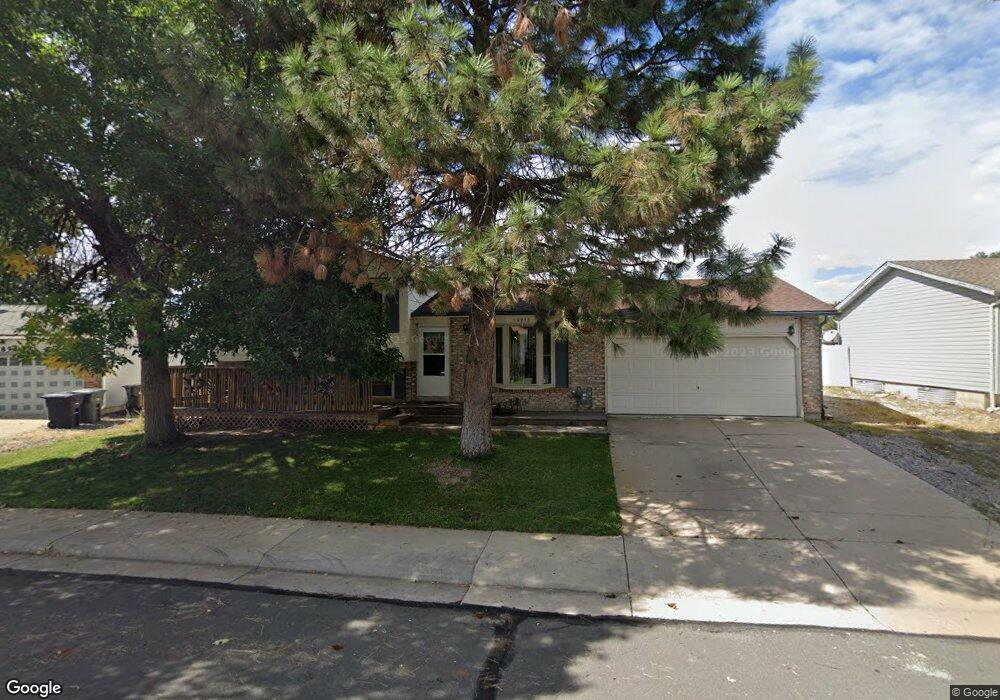
10913 Elm Dr Thornton, CO 80233
Grange Creek NeighborhoodEstimated Value: $459,275 - $547,000
4
Beds
2
Baths
1,704
Sq Ft
$290/Sq Ft
Est. Value
About This Home
This home is located at 10913 Elm Dr, Thornton, CO 80233 and is currently estimated at $493,569, approximately $289 per square foot. 10913 Elm Dr is a home located in Adams County with nearby schools including Riverdale Elementary School, Shadow Ridge Middle School, and Thornton High School.
Ownership History
Date
Name
Owned For
Owner Type
Purchase Details
Closed on
Nov 21, 2008
Sold by
Antcliff Richard E and Antcliff Cheryl L
Bought by
Trujillo David and Trujillo Paula S
Current Estimated Value
Home Financials for this Owner
Home Financials are based on the most recent Mortgage that was taken out on this home.
Original Mortgage
$180,171
Outstanding Balance
$117,682
Interest Rate
5.98%
Mortgage Type
FHA
Estimated Equity
$375,887
Purchase Details
Closed on
Jul 29, 1997
Sold by
Moss Lawrence K and Moss Colleen K
Bought by
Antcliff Richard E and Antcliff Cheryl L
Home Financials for this Owner
Home Financials are based on the most recent Mortgage that was taken out on this home.
Original Mortgage
$116,750
Interest Rate
7.6%
Purchase Details
Closed on
Jul 9, 1992
Purchase Details
Closed on
Mar 3, 1992
Create a Home Valuation Report for This Property
The Home Valuation Report is an in-depth analysis detailing your home's value as well as a comparison with similar homes in the area
Home Values in the Area
Average Home Value in this Area
Purchase History
| Date | Buyer | Sale Price | Title Company |
|---|---|---|---|
| Trujillo David | $182,550 | Empire Title North Llc | |
| Antcliff Richard E | $122,900 | Land Title | |
| -- | $76,000 | -- | |
| -- | $58,000 | -- |
Source: Public Records
Mortgage History
| Date | Status | Borrower | Loan Amount |
|---|---|---|---|
| Open | Trujillo David | $180,171 | |
| Previous Owner | Antcliff Richard E | $116,750 |
Source: Public Records
Tax History Compared to Growth
Tax History
| Year | Tax Paid | Tax Assessment Tax Assessment Total Assessment is a certain percentage of the fair market value that is determined by local assessors to be the total taxable value of land and additions on the property. | Land | Improvement |
|---|---|---|---|---|
| 2024 | $3,131 | $29,250 | $5,940 | $23,310 |
| 2023 | $3,099 | $33,960 | $6,090 | $27,870 |
| 2022 | $2,514 | $22,820 | $5,700 | $17,120 |
| 2021 | $2,597 | $22,820 | $5,700 | $17,120 |
| 2020 | $2,491 | $22,330 | $5,860 | $16,470 |
| 2019 | $2,496 | $22,330 | $5,860 | $16,470 |
| 2018 | $2,122 | $18,440 | $5,760 | $12,680 |
| 2017 | $1,929 | $18,440 | $5,760 | $12,680 |
| 2016 | $1,658 | $15,430 | $3,260 | $12,170 |
| 2015 | $1,656 | $15,430 | $3,260 | $12,170 |
| 2014 | $1,470 | $13,320 | $2,550 | $10,770 |
Source: Public Records
Map
Nearby Homes
- 10895 Fairfax Way
- 11068 Eudora Cir
- 4807 E 110th Place
- 10985 Glencoe Place
- 11062 Fairfax Cir
- 5452 E 108th Place
- 10979 Grange Creek Dr
- 11135 Clermont Dr
- 4310 E 107th Ct
- 4205 E 106th Place
- 5056 E 112th Ct
- 4520 E 112th Place
- 5055 E 112th Ct
- 4911 E 112th Place
- 11293 Holly St
- 11279 Holly St
- 4970 Homestead Place Unit 20
- 4346 E 113th Place
- 11343 Grape Cir
- 10752 Madison St
- 10923 Elm Dr
- 10893 Elm Dr
- 10916 Dahlia Way
- 10906 Dahlia Way
- 10894 Elm Dr
- 10933 Elm Dr
- 10914 Elm Dr
- 10886 Dahlia Way
- 10936 Dahlia Way
- 10874 Elm Dr
- 10873 Elm Dr
- 10924 Elm Dr
- 10943 Elm Dr
- 10866 Dahlia Way
- 4692 E 109th Ct
- 10940 Dahlia Way
- 10855 Fairfax Way
- 10934 Elm Dr
- 10863 Fairfax Way
- 10873 Fairfax Way