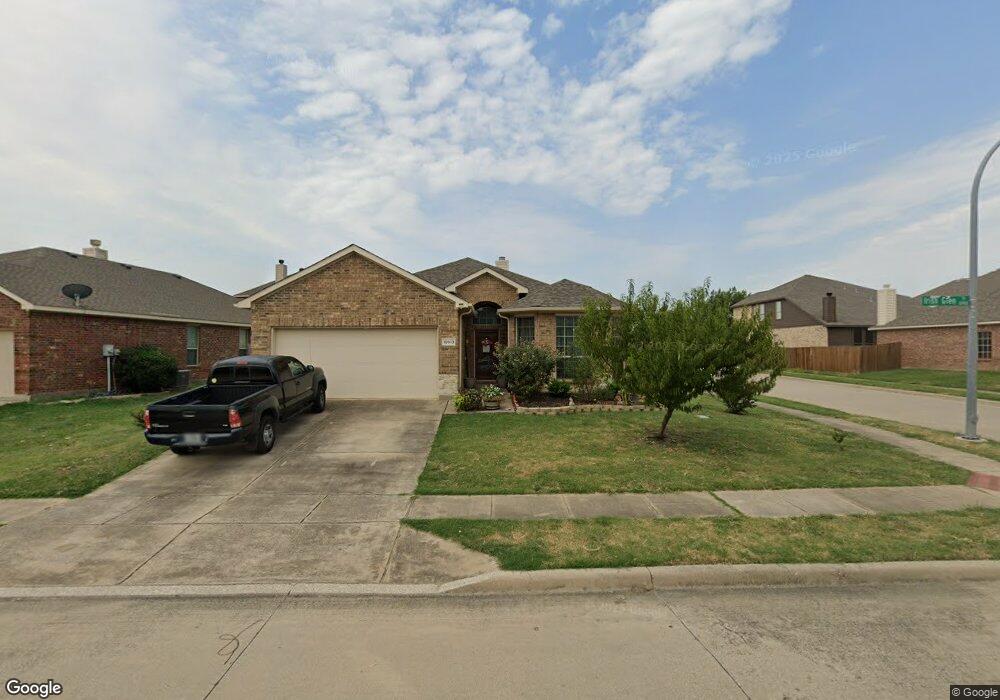
10913 Irish Glen Trail Haslet, TX 76052
Estimated Value: $304,461 - $317,000
3
Beds
2
Baths
1,706
Sq Ft
$183/Sq Ft
Est. Value
About This Home
This home is located at 10913 Irish Glen Trail, Haslet, TX 76052 and is currently estimated at $311,365, approximately $182 per square foot. 10913 Irish Glen Trail is a home located in Tarrant County with nearby schools including Leo Adams Middle School, V.R. Eaton High School, and International Leadership Of Texas Elementary - Keller.
Ownership History
Date
Name
Owned For
Owner Type
Purchase Details
Closed on
Dec 31, 2018
Sold by
Daidone Anthony Thomas
Bought by
Churchwell Sherri
Current Estimated Value
Purchase Details
Closed on
Aug 17, 2015
Sold by
Daidone Tony and Daidone Tei Ki
Bought by
Daidone Anthony Thomas
Home Financials for this Owner
Home Financials are based on the most recent Mortgage that was taken out on this home.
Original Mortgage
$118,100
Interest Rate
4.12%
Mortgage Type
New Conventional
Purchase Details
Closed on
Oct 23, 2009
Sold by
D R Horton Texas Ltd
Bought by
Daidone Anthony Thomas and Daidone Tony
Home Financials for this Owner
Home Financials are based on the most recent Mortgage that was taken out on this home.
Original Mortgage
$126,598
Interest Rate
5.14%
Mortgage Type
FHA
Create a Home Valuation Report for This Property
The Home Valuation Report is an in-depth analysis detailing your home's value as well as a comparison with similar homes in the area
Home Values in the Area
Average Home Value in this Area
Purchase History
| Date | Buyer | Sale Price | Title Company |
|---|---|---|---|
| Churchwell Sherri | -- | Lawyers Title | |
| Daidone Anthony Thomas | -- | Attorney | |
| Daidone Anthony Thomas | -- | None Available |
Source: Public Records
Mortgage History
| Date | Status | Borrower | Loan Amount |
|---|---|---|---|
| Previous Owner | Daidone Anthony Thomas | $118,100 | |
| Previous Owner | Daidone Anthony Thomas | $126,598 |
Source: Public Records
Tax History Compared to Growth
Tax History
| Year | Tax Paid | Tax Assessment Tax Assessment Total Assessment is a certain percentage of the fair market value that is determined by local assessors to be the total taxable value of land and additions on the property. | Land | Improvement |
|---|---|---|---|---|
| 2025 | $2,578 | $253,000 | $75,000 | $178,000 |
| 2024 | $2,578 | $273,043 | $75,000 | $198,043 |
| 2023 | $6,188 | $311,118 | $45,000 | $266,118 |
| 2022 | $6,375 | $261,160 | $45,000 | $216,160 |
| 2021 | $6,331 | $225,898 | $45,000 | $180,898 |
| 2020 | $5,760 | $209,000 | $45,000 | $164,000 |
| 2019 | $5,997 | $209,000 | $45,000 | $164,000 |
| 2018 | $1,936 | $158,389 | $45,000 | $113,389 |
| 2017 | $4,196 | $173,501 | $28,000 | $145,501 |
| 2016 | $3,815 | $160,344 | $28,000 | $132,344 |
| 2015 | $3,299 | $119,000 | $28,000 | $91,000 |
| 2014 | $3,299 | $134,000 | $28,000 | $106,000 |
Source: Public Records
Map
Nearby Homes
- 10901 Irish Glen Trail
- 10864 Irish Glen Trail
- 10861 Middleglen Rd
- 10901 Middleglen Rd
- 10913 Middleglen Rd
- 11029 Hawks Landing Rd
- 10820 Middleglen Rd
- 653 Mistymoor Ln
- 10748 Irish Glen Trail
- 10837 Braemoor Dr
- 10745 Irish Glen Trail
- 424 Baverton Ln
- 545 Winbridge Ln
- 11301 Golden Ridge Ln
- 441 Delgany Trail
- 1401 Thunderbird Dr
- 11324 Gold Canyon Dr
- 10625 Ashmore Dr
- 11416 Dorado Vista Trail
- 10608 Big Oak Dr
- 10905 Irish Glen Trail
- 10872 Middleglen Rd
- 10921 Irish Glen Trail
- 10868 Middleglen Rd
- 10912 Irish Glen Trail
- 10908 Irish Glen Trail
- 10900 Middleglen Rd
- 10916 Irish Glen Trail
- 10925 Irish Glen Trail
- 10864 Middleglen Rd
- 10873 Irish Glen Trail
- 612 Irish Glen Ct
- 10920 Irish Glen Trail
- 10904 Middleglen Rd
- 10929 Irish Glen Trail
- 10869 Irish Glen Trail
- 10924 Irish Glen Trail
- 10860 Middleglen Rd
- 608 Irish Glen Ct
- 10873 Middleglen Rd