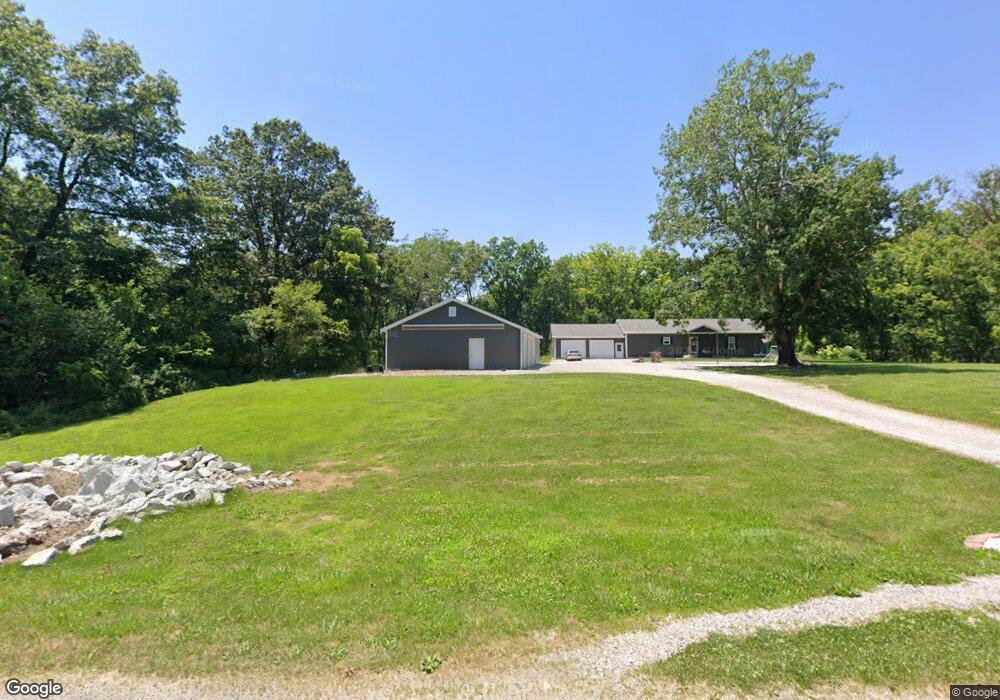
10913 Litchfield Trail Litchfield, IL 62056
--
Bed
--
Bath
--
Sq Ft
14.55
Acres
About This Home
This home is located at 10913 Litchfield Trail, Litchfield, IL 62056. 10913 Litchfield Trail is a home located in Macoupin County with nearby schools including Ben-Gil Elementary School, Gillespie Middle School, and Gillespie High School.
Ownership History
Date
Name
Owned For
Owner Type
Purchase Details
Closed on
Sep 21, 2020
Sold by
Melchert Jonathan D
Bought by
Melchert Jonathan D and Melchert Rheanne
Home Financials for this Owner
Home Financials are based on the most recent Mortgage that was taken out on this home.
Original Mortgage
$251,200
Outstanding Balance
$221,245
Interest Rate
2.5%
Mortgage Type
New Conventional
Purchase Details
Closed on
Aug 1, 2013
Sold by
Melchert Jonathan
Bought by
Melchert Ii Thomas
Home Financials for this Owner
Home Financials are based on the most recent Mortgage that was taken out on this home.
Original Mortgage
$11,174
Interest Rate
4.25%
Purchase Details
Closed on
Oct 30, 2012
Sold by
Frerichs Julie
Bought by
Melehert Jonathan D
Home Financials for this Owner
Home Financials are based on the most recent Mortgage that was taken out on this home.
Original Mortgage
$112,500
Interest Rate
3.32%
Mortgage Type
Purchase Money Mortgage
Create a Home Valuation Report for This Property
The Home Valuation Report is an in-depth analysis detailing your home's value as well as a comparison with similar homes in the area
Home Values in the Area
Average Home Value in this Area
Purchase History
| Date | Buyer | Sale Price | Title Company |
|---|---|---|---|
| Melchert Jonathan D | -- | None Available | |
| Melchert Ii Thomas | -- | -- | |
| Melehert Jonathan D | $85,000 | -- |
Source: Public Records
Mortgage History
| Date | Status | Borrower | Loan Amount |
|---|---|---|---|
| Open | Melchert Jonathan D | $251,200 | |
| Closed | Melchert Ii Thomas | $11,174 | |
| Previous Owner | Melehert Jonathan D | $112,500 |
Source: Public Records
Tax History Compared to Growth
Tax History
| Year | Tax Paid | Tax Assessment Tax Assessment Total Assessment is a certain percentage of the fair market value that is determined by local assessors to be the total taxable value of land and additions on the property. | Land | Improvement |
|---|---|---|---|---|
| 2024 | $3,129 | $68,039 | $1,711 | $66,328 |
| 2023 | $3,048 | $62,971 | $1,556 | $61,415 |
| 2022 | $3,048 | $58,816 | $1,419 | $57,397 |
| 2021 | $2,904 | $60,887 | $1,245 | $59,642 |
| 2020 | $2,990 | $59,796 | $1,206 | $58,590 |
| 2019 | $3,284 | $55,830 | $1,109 | $54,721 |
| 2018 | $645 | $14,439 | $0 | $0 |
| 2017 | $635 | $15,428 | $954 | $14,474 |
| 2016 | $634 | $15,374 | $900 | $14,474 |
| 2015 | $641 | $15,325 | $851 | $14,474 |
| 2014 | $648 | $15,325 | $851 | $14,474 |
| 2013 | $795 | $18,395 | $3,227 | $15,168 |
Source: Public Records
Map
Nearby Homes
- TBD Adams St
- 11 Dayspring
- 10160 Old Route 66
- 347 S Lincoln St
- 709 S Jefferson St
- 512 W Kirkham St
- TBD S State St
- 204 E Columbia St
- 821 N Madison St
- 821 N State St
- 123 W Ferdon St
- 704 N Monroe St
- 821 S Chestnut St
- 211 E Beach St
- 836 S Chestnut St
- 817 S Montgomery Ave
- 305 E Hauser St
- 419 E Corwin St
- TBD N Van Buren St
- 413 E Beach St
- 22987 White Park Ln
- 22987 White Park Ln
- 23288 Airport Trail
- 23248 Airport Trail
- 11229 Litchfield Trail
- 11209 Litchfield Trail
- 11361 Litchfield Trail
- 22626 White Park Ln
- 22501 White Park Ln
- 22485 White Park Ln
- 23584 Airport Trail
- 22911 S Hornsby Rd
- 22725 S Hornsby Rd
- 22217 Brand Trail Ln
- 23597 Airport Trail
- 22746 S Hornsby Rd
- 23513 S Hornsby Rd
- 23818 Airport Trail
- 22005 Brand Trail Ln
- 23687 S Hornsby Rd