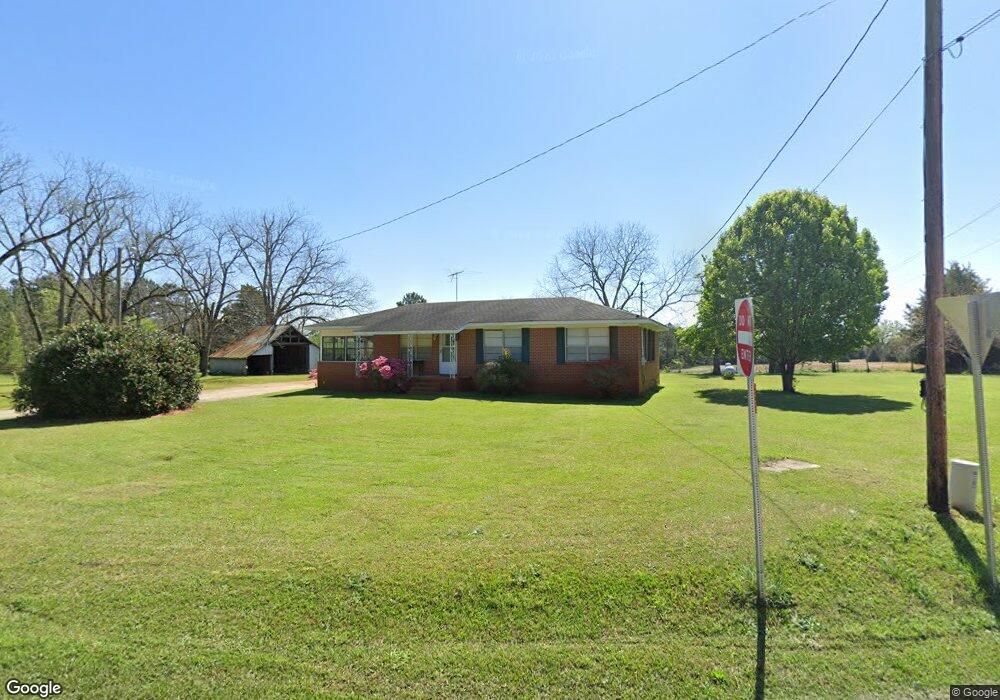
10916 Ga Highway 80 N Norwood, GA 30821
Estimated Value: $87,353 - $182,000
--
Bed
--
Bath
1,008
Sq Ft
$132/Sq Ft
Est. Value
About This Home
This home is located at 10916 Ga Highway 80 N, Norwood, GA 30821 and is currently estimated at $132,784, approximately $131 per square foot. 10916 Ga Highway 80 N is a home located in Warren County with nearby schools including Freeman Elementary School, Warren County Middle School, and Warren County High School.
Ownership History
Date
Name
Owned For
Owner Type
Purchase Details
Closed on
Jan 31, 2020
Sold by
Hubbard Ann
Bought by
Adams John Jacob and John Jacob Adams And Mattie C Adams Rev
Current Estimated Value
Purchase Details
Closed on
Apr 3, 2019
Sold by
Hubbard Ann
Bought by
Doolittle Sammy D and Finley Jennifer C
Purchase Details
Closed on
Jan 16, 2018
Sold by
Hyman
Bought by
Hubbard Ann
Purchase Details
Closed on
Mar 26, 2008
Sold by
Hyman Ruth
Bought by
Dasher Byron G
Purchase Details
Closed on
Mar 24, 2008
Sold by
Newsome John T
Bought by
Hyman Glenn and Hyman Ruth M
Purchase Details
Closed on
Mar 6, 2008
Sold by
Hyman Ruth M
Bought by
Elam Amy
Purchase Details
Closed on
Mar 20, 1999
Sold by
Hyman Glenn A and Hyman Ruth
Bought by
Hyman Ruth M and Hyman Ruth
Purchase Details
Closed on
Apr 3, 1998
Sold by
Newsome Annie H
Bought by
Newsome Robert W and Newsome J
Purchase Details
Closed on
Apr 10, 1959
Bought by
Newsome Mrs Rv
Create a Home Valuation Report for This Property
The Home Valuation Report is an in-depth analysis detailing your home's value as well as a comparison with similar homes in the area
Home Values in the Area
Average Home Value in this Area
Purchase History
| Date | Buyer | Sale Price | Title Company |
|---|---|---|---|
| Adams John Jacob | $33,000 | -- | |
| Doolittle Sammy D | $18,500 | -- | |
| Hubbard Ann | -- | -- | |
| Dasher Byron G | $178,560 | -- | |
| Hyman Glenn | -- | -- | |
| Elam Amy | $20,000 | -- | |
| Hyman Ruth M | -- | -- | |
| Newsome Robert W | -- | -- | |
| Newsome Mrs Rv | -- | -- |
Source: Public Records
Tax History Compared to Growth
Tax History
| Year | Tax Paid | Tax Assessment Tax Assessment Total Assessment is a certain percentage of the fair market value that is determined by local assessors to be the total taxable value of land and additions on the property. | Land | Improvement |
|---|---|---|---|---|
| 2024 | $685 | $22,080 | $1,043 | $21,037 |
| 2023 | $634 | $20,393 | $1,043 | $19,350 |
| 2022 | $634 | $20,393 | $1,043 | $19,350 |
| 2021 | $410 | $20,393 | $1,043 | $19,350 |
| 2020 | $638 | $20,393 | $1,043 | $19,350 |
| 2019 | $855 | $27,274 | $7,844 | $19,430 |
| 2018 | $828 | $27,274 | $7,844 | $19,430 |
| 2017 | $684 | $27,274 | $7,844 | $19,430 |
| 2016 | $883 | $27,274 | $7,844 | $19,430 |
| 2015 | -- | $20,857 | $1,426 | $19,430 |
| 2014 | -- | $20,857 | $1,426 | $19,430 |
| 2013 | -- | $27,274 | $7,844 | $19,430 |
Source: Public Records
Map
Nearby Homes
- 1 Lithonia Church Rd
- 1078 Lithonia Church Rd
- 0 Frank Smith Rd
- 3 Norwood Camak Rd
- 6 Norwood Camak Rd
- 5 Norwood Camak Rd
- 6367 Atlanta Hwy
- 00 Ga Highway 80 E
- MacEdonia Church Road McRae Unit GA 31055
- 0 3 Points Rd
- 00 Three Points Rd
- 1403 Tanyard Creek Dr
- 3678 Lundberg Rd
- 3287 Surrey Rd
- 0 Prospect Church Rd
- 007 Surrey Rd
- 3159 Twin Pine Rd
- 3104 Twin Pine Rd
- 1919 Ridgeview Dr
- 2142 Ridgeview Dr
- 10916B Ga Highway 80 N
- 10916B Ga Highway 80 N
- 10963 Ga Highway 80 N
- 11023 Ga Highway 80 N
- 6687 Cadley Rd Unit 6655
- 10620 Ga Highway 80 N
- 6528 Cadley Rd
- 11303 Ga Highway 80 N
- 11342 Ga Highway 80 N
- 6476 Cadley Rd
- 6644 Cadley Rd
- 6334 Cadley Rd
- 6288 Cadley Rd
- 6249 Cadley Rd
- 10236 Ga Highway 80 N
- 10205 Ga Highway 80 N
- 10205 Ga Highway 80 N
- 11797 Ga Highway 80 N
- 6162 Cadley Rd
- 105 Indian Hill Rd