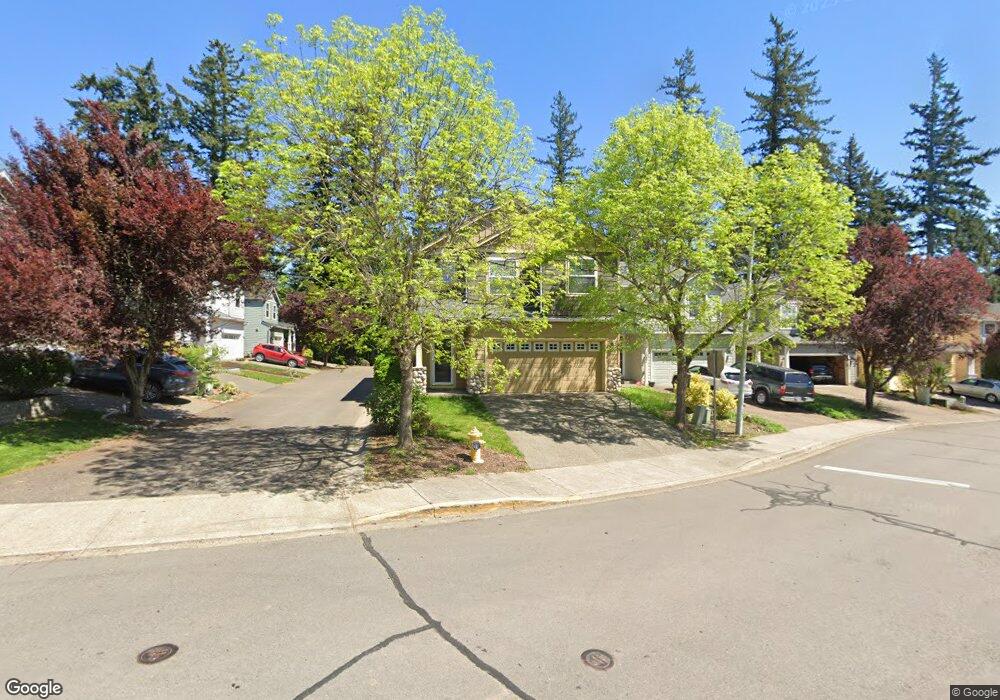
1092 57th St Washougal, WA 98671
Estimated Value: $503,000 - $605,000
2
Beds
3
Baths
1,853
Sq Ft
$306/Sq Ft
Est. Value
About This Home
This home is located at 1092 57th St, Washougal, WA 98671 and is currently estimated at $566,685, approximately $305 per square foot. 1092 57th St is a home located in Clark County with nearby schools including Columbia River Gorge Elementary School, Jemtegaard Middle School, and Washougal High School.
Ownership History
Date
Name
Owned For
Owner Type
Purchase Details
Closed on
Jan 23, 2013
Sold by
Nichols Paul A and Nichols Jodi Y
Bought by
Gudyma Maksym and Gudyma Oksana
Current Estimated Value
Home Financials for this Owner
Home Financials are based on the most recent Mortgage that was taken out on this home.
Original Mortgage
$6,395
Outstanding Balance
$4,452
Interest Rate
3.32%
Mortgage Type
Stand Alone Second
Estimated Equity
$562,233
Purchase Details
Closed on
Mar 28, 2008
Sold by
Nichols Paul A
Bought by
Nichols Paul A and Nichols Jodi Y
Purchase Details
Closed on
Dec 2, 2004
Sold by
Pacific Lifestyle Homes Inc
Bought by
Nichols Paul A
Home Financials for this Owner
Home Financials are based on the most recent Mortgage that was taken out on this home.
Original Mortgage
$191,900
Interest Rate
5.65%
Mortgage Type
Purchase Money Mortgage
Create a Home Valuation Report for This Property
The Home Valuation Report is an in-depth analysis detailing your home's value as well as a comparison with similar homes in the area
Home Values in the Area
Average Home Value in this Area
Purchase History
| Date | Buyer | Sale Price | Title Company |
|---|---|---|---|
| Gudyma Maksym | $162,900 | Cascade Title | |
| Nichols Paul A | -- | None Available | |
| Nichols Paul A | $239,954 | Cascade Title |
Source: Public Records
Mortgage History
| Date | Status | Borrower | Loan Amount |
|---|---|---|---|
| Open | Gudyma Maksym | $6,395 | |
| Open | Gudyma Maksym | $159,948 | |
| Previous Owner | Nichols Paul A | $191,900 | |
| Closed | Nichols Paul A | $35,900 |
Source: Public Records
Tax History Compared to Growth
Tax History
| Year | Tax Paid | Tax Assessment Tax Assessment Total Assessment is a certain percentage of the fair market value that is determined by local assessors to be the total taxable value of land and additions on the property. | Land | Improvement |
|---|---|---|---|---|
| 2025 | $4,815 | $504,947 | $120,000 | $384,947 |
| 2024 | $4,664 | $507,494 | $143,000 | $364,494 |
| 2023 | $3,858 | $450,080 | $160,768 | $289,312 |
| 2022 | $3,874 | $416,583 | $151,867 | $264,716 |
| 2021 | $3,577 | $363,071 | $131,500 | $231,571 |
| 2020 | $3,577 | $314,564 | $120,000 | $194,564 |
| 2019 | $3,035 | $319,531 | $120,000 | $199,531 |
| 2018 | $3,286 | $286,692 | $0 | $0 |
| 2017 | $2,840 | $256,192 | $0 | $0 |
| 2016 | $2,682 | $243,140 | $0 | $0 |
| 2015 | $2,577 | $209,975 | $0 | $0 |
| 2014 | -- | $200,750 | $0 | $0 |
| 2013 | -- | $176,915 | $0 | $0 |
Source: Public Records
Map
Nearby Homes