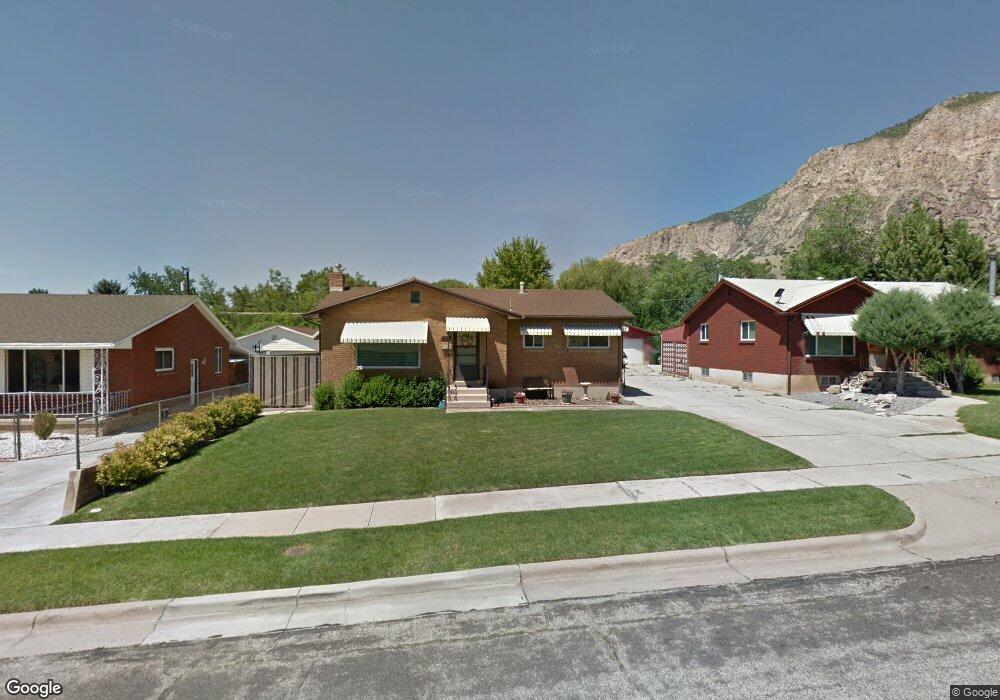
1092 5th St Ogden, UT 84404
Hillcrest-Bonneville NeighborhoodEstimated Value: $376,000 - $409,937
3
Beds
2
Baths
2,042
Sq Ft
$192/Sq Ft
Est. Value
About This Home
This home is located at 1092 5th St, Ogden, UT 84404 and is currently estimated at $391,234, approximately $191 per square foot. 1092 5th St is a home located in Weber County with nearby schools including Highland Junior High School and Ben Lomond High School.
Ownership History
Date
Name
Owned For
Owner Type
Purchase Details
Closed on
May 5, 2011
Sold by
Larson Donna L
Bought by
Larson Donna L
Current Estimated Value
Purchase Details
Closed on
Dec 12, 2000
Sold by
Donna L Larson Revocable Living Trust
Bought by
Lopez Claudia and Martinez William
Home Financials for this Owner
Home Financials are based on the most recent Mortgage that was taken out on this home.
Original Mortgage
$332,000
Interest Rate
5.1%
Mortgage Type
New Conventional
Purchase Details
Closed on
Jan 2, 1998
Sold by
Taylor Wayne A
Bought by
Taylor Wayne A and Rasmussen Brent
Create a Home Valuation Report for This Property
The Home Valuation Report is an in-depth analysis detailing your home's value as well as a comparison with similar homes in the area
Home Values in the Area
Average Home Value in this Area
Purchase History
| Date | Buyer | Sale Price | Title Company |
|---|---|---|---|
| Larson Donna L | -- | None Available | |
| Lopez Claudia | -- | Cottonwood Title | |
| Larson Donna L | -- | -- | |
| Taylor Wayne A | -- | First American Title |
Source: Public Records
Mortgage History
| Date | Status | Borrower | Loan Amount |
|---|---|---|---|
| Previous Owner | Lopez Claudia | $332,000 |
Source: Public Records
Tax History
| Year | Tax Paid | Tax Assessment Tax Assessment Total Assessment is a certain percentage of the fair market value that is determined by local assessors to be the total taxable value of land and additions on the property. | Land | Improvement |
|---|---|---|---|---|
| 2025 | $2,993 | $402,480 | $113,665 | $288,815 |
| 2024 | $2,840 | $207,898 | $62,519 | $145,379 |
| 2023 | $2,645 | $195,250 | $57,206 | $138,044 |
| 2022 | $3,035 | $228,250 | $49,072 | $179,178 |
| 2021 | $2,399 | $295,000 | $54,314 | $240,686 |
| 2020 | $2,171 | $245,000 | $39,429 | $205,571 |
| 2019 | $2,041 | $215,000 | $34,401 | $180,599 |
| 2018 | $1,892 | $197,000 | $29,370 | $167,630 |
| 2017 | $1,825 | $177,000 | $28,508 | $148,492 |
| 2016 | $1,693 | $88,333 | $16,526 | $71,807 |
| 2015 | $1,482 | $75,285 | $16,526 | $58,759 |
| 2014 | $1,509 | $75,726 | $15,445 | $60,281 |
Source: Public Records
Map
Nearby Homes
- 1108 5th St
- 1062 Hudson St
- 1029 Douglas St
- 1042 Douglas St
- 415 Jackson Ave
- 322 Harrison Blvd
- 580 Marco Ln
- 1243 Hudson St
- 1274 5th St
- 142 S Eccles Ave
- 1385 Hiland Rd
- 1010 1st St
- 3270 N 3325 W Unit 386B
- 983 Rancho Blvd Unit 3
- 1453 Lewis Dr
- 758 3rd St
- 756 3rd St
- 630 S Plum Creek Ln E
- 186 N Harrison Blvd Unit 1
- 598 Plum Creek Ln
Your Personal Tour Guide
Ask me questions while you tour the home.