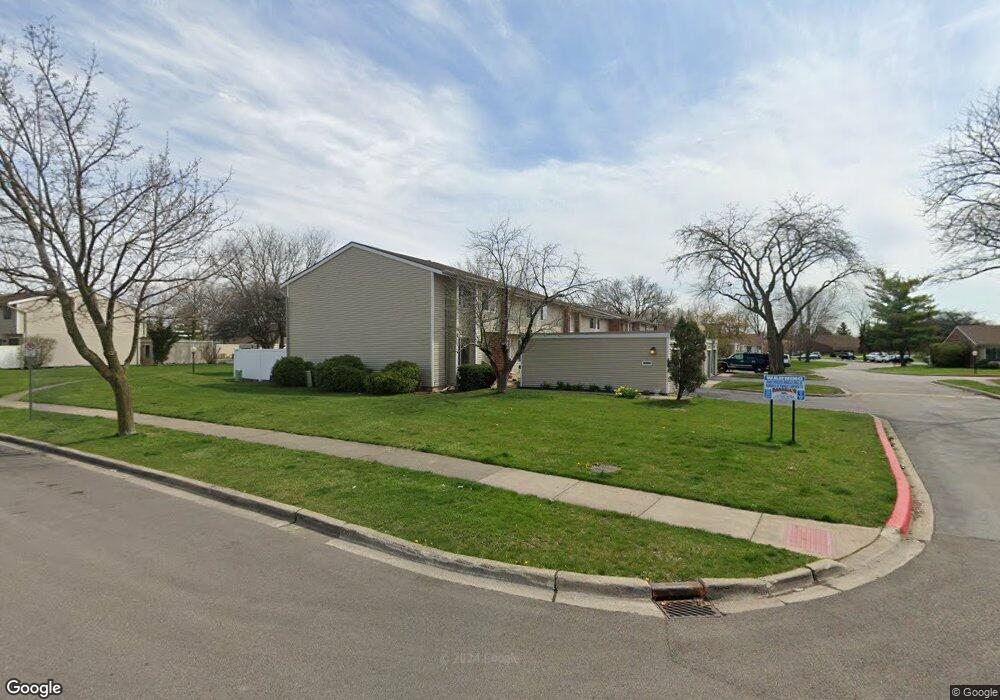
1092 Cascade Dr Aurora, IL 60506
Edgelawn Randall NeighborhoodEstimated Value: $225,000 - $273,000
3
Beds
3
Baths
1,206
Sq Ft
$209/Sq Ft
Est. Value
About This Home
This home is located at 1092 Cascade Dr, Aurora, IL 60506 and is currently estimated at $251,955, approximately $208 per square foot. 1092 Cascade Dr is a home located in Kane County with nearby schools including Hall Elementary School, Jefferson Middle School, and West Aurora High School.
Ownership History
Date
Name
Owned For
Owner Type
Purchase Details
Closed on
May 18, 2017
Sold by
Wilmington Savings Fund Society Fsb
Bought by
Ortiz Alejandro R
Current Estimated Value
Home Financials for this Owner
Home Financials are based on the most recent Mortgage that was taken out on this home.
Original Mortgage
$122,735
Interest Rate
4.87%
Mortgage Type
FHA
Purchase Details
Closed on
May 15, 2017
Sold by
Wilmington Saving Fund Society
Bought by
Ortiz Alejandro R
Home Financials for this Owner
Home Financials are based on the most recent Mortgage that was taken out on this home.
Original Mortgage
$122,735
Interest Rate
4.87%
Mortgage Type
FHA
Purchase Details
Closed on
Dec 7, 2000
Sold by
Muzzarelli Robert L and Muzzarelli Lorie
Bought by
Hill Mary B
Home Financials for this Owner
Home Financials are based on the most recent Mortgage that was taken out on this home.
Original Mortgage
$106,841
Interest Rate
7.8%
Mortgage Type
FHA
Create a Home Valuation Report for This Property
The Home Valuation Report is an in-depth analysis detailing your home's value as well as a comparison with similar homes in the area
Home Values in the Area
Average Home Value in this Area
Purchase History
| Date | Buyer | Sale Price | Title Company |
|---|---|---|---|
| Ortiz Alejandro R | -- | Real Estate Title Co | |
| Ortiz Alejandro R | $125,000 | Real Eastate Title Co | |
| Hill Mary B | $107,500 | Chicago Title Insurance Co |
Source: Public Records
Mortgage History
| Date | Status | Borrower | Loan Amount |
|---|---|---|---|
| Previous Owner | Ortiz Alejandro R | $122,735 | |
| Previous Owner | Ortiz Alejandro R | $122,735 | |
| Previous Owner | Hill Mary B | $106,841 |
Source: Public Records
Tax History
| Year | Tax Paid | Tax Assessment Tax Assessment Total Assessment is a certain percentage of the fair market value that is determined by local assessors to be the total taxable value of land and additions on the property. | Land | Improvement |
|---|---|---|---|---|
| 2024 | $4,505 | $64,893 | $5,302 | $59,591 |
| 2023 | $4,281 | $57,981 | $4,737 | $53,244 |
| 2022 | $4,152 | $52,902 | $4,322 | $48,580 |
| 2021 | $3,952 | $49,253 | $4,024 | $45,229 |
| 2020 | $3,721 | $45,749 | $3,738 | $42,011 |
| 2019 | $3,558 | $42,387 | $3,463 | $38,924 |
| 2018 | $3,240 | $38,460 | $3,203 | $35,257 |
| 2017 | $332,340 | $32,292 | $2,951 | $29,341 |
| 2016 | $2,858 | $26,903 | $2,530 | $24,373 |
| 2015 | -- | $23,841 | $2,176 | $21,665 |
| 2014 | -- | $21,833 | $2,093 | $19,740 |
| 2013 | -- | $21,522 | $2,063 | $19,459 |
Source: Public Records
Map
Nearby Homes
- 980 Sapphire Ln
- 968 Sapphire Ln
- 960 Sapphire Ln
- 972 Sapphire Ln
- 988 Sapphire Ln
- 976 Sapphire Ln
- 984 Sapphire Ln
- 991 Sapphire Ln
- 959 Sapphire Ln
- 975 Sapphire Ln
- 963 Sapphire Ln
- 987 Sapphire Ln
- 1322 Croton Ct Unit A
- 1071 Almond Dr
- 1421 Heather Dr
- 833 N Randall Rd Unit C4
- 1387 S Glen Cir Unit D
- 1475 Elder Dr
- 1847 Brighton Cir
- 2140 Sandburg Dr
- 1090 Cascade Dr Unit 1
- 1094 Cascade Dr
- 1088 Cascade Dr Unit 1
- 1086 Cascade Dr Unit 1
- 1084 Cascade Dr
- 1082 Cascade Dr
- 1082 Cascade Dr Unit 1
- 1080 Cascade Dr
- 1081 Cascade Dr Unit 1
- 1095 Rainwood Dr Unit 1
- 1078 Cascade Dr
- 1083 Cascade Dr
- 1093 Rainwood Dr
- 1085 Cascade Dr
- 1075 Rainwood Dr Unit 1
- 1091 Rainwood Dr
- 1087 Cascade Dr
- 1087 Cascade Dr Unit 87
- 1063 Cascade Dr
- 1073 Rainwood Dr
Your Personal Tour Guide
Ask me questions while you tour the home.