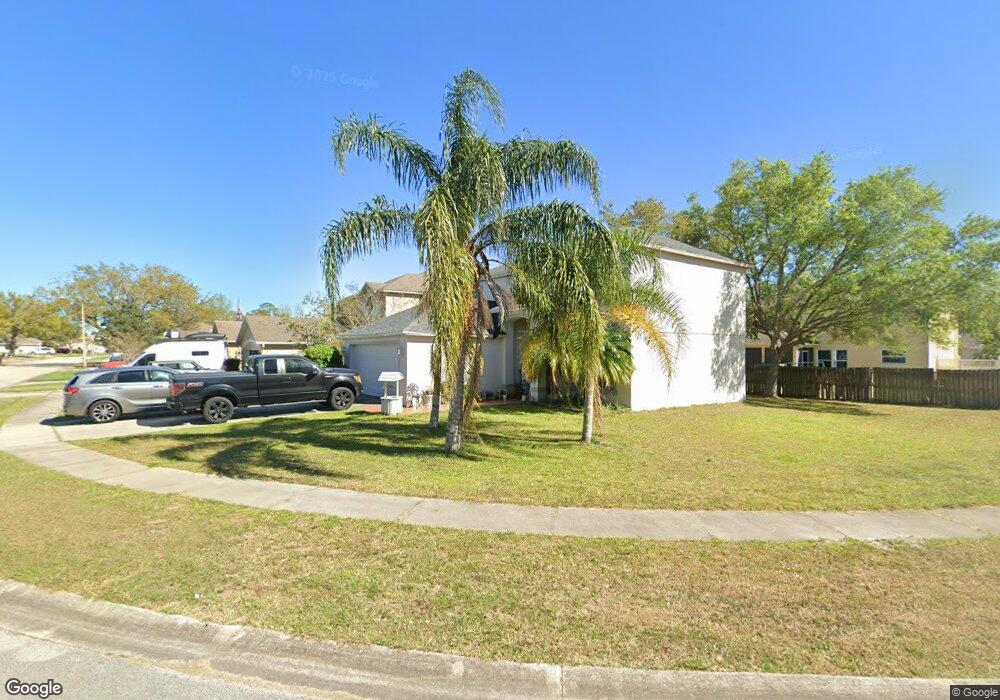
1092 Horizon View Blvd Port Orange, FL 32129
Willow Run NeighborhoodEstimated Value: $336,099 - $371,000
3
Beds
3
Baths
1,744
Sq Ft
$204/Sq Ft
Est. Value
About This Home
This home is located at 1092 Horizon View Blvd, Port Orange, FL 32129 and is currently estimated at $355,525, approximately $203 per square foot. 1092 Horizon View Blvd is a home located in Volusia County with nearby schools including Horizon Elementary School, Atlantic High School, and Silver Sands Middle School.
Ownership History
Date
Name
Owned For
Owner Type
Purchase Details
Closed on
Jun 29, 2006
Sold by
Caldwell Karen
Bought by
Caldwell Tom
Current Estimated Value
Purchase Details
Closed on
Jan 4, 2005
Sold by
Masarone Joseph K
Bought by
Caldwell Thomas
Home Financials for this Owner
Home Financials are based on the most recent Mortgage that was taken out on this home.
Original Mortgage
$75,000
Interest Rate
5.63%
Mortgage Type
New Conventional
Purchase Details
Closed on
Feb 28, 2002
Sold by
Masterpiece Homes Inc
Bought by
Masarone Joseph K
Home Financials for this Owner
Home Financials are based on the most recent Mortgage that was taken out on this home.
Original Mortgage
$140,801
Interest Rate
6.98%
Mortgage Type
VA
Purchase Details
Closed on
Nov 2, 2001
Sold by
Dave Robinson Bldr & Dev Inc
Bought by
Masterpiece Home Inc
Create a Home Valuation Report for This Property
The Home Valuation Report is an in-depth analysis detailing your home's value as well as a comparison with similar homes in the area
Home Values in the Area
Average Home Value in this Area
Purchase History
| Date | Buyer | Sale Price | Title Company |
|---|---|---|---|
| Caldwell Tom | -- | None Available | |
| Caldwell Thomas | $215,000 | Southern Title Hldg Co Llc | |
| Masarone Joseph K | $136,700 | -- | |
| Masterpiece Home Inc | $27,000 | -- |
Source: Public Records
Mortgage History
| Date | Status | Borrower | Loan Amount |
|---|---|---|---|
| Previous Owner | Caldwell Thomas | $75,000 | |
| Previous Owner | Masarone Joseph K | $140,801 |
Source: Public Records
Tax History Compared to Growth
Tax History
| Year | Tax Paid | Tax Assessment Tax Assessment Total Assessment is a certain percentage of the fair market value that is determined by local assessors to be the total taxable value of land and additions on the property. | Land | Improvement |
|---|---|---|---|---|
| 2025 | $4,725 | $301,596 | $60,000 | $241,596 |
| 2024 | $4,725 | $304,212 | $58,000 | $246,212 |
| 2023 | $4,725 | $284,204 | $43,000 | $241,204 |
| 2022 | $4,234 | $243,214 | $29,300 | $213,914 |
| 2021 | $4,021 | $208,835 | $29,300 | $179,535 |
| 2020 | $3,814 | $202,424 | $30,000 | $172,424 |
| 2019 | $3,455 | $184,873 | $21,500 | $163,373 |
| 2018 | $3,202 | $164,426 | $21,500 | $142,926 |
| 2017 | $3,044 | $151,443 | $21,000 | $130,443 |
| 2016 | $2,984 | $143,819 | $0 | $0 |
| 2015 | $2,939 | $141,279 | $0 | $0 |
| 2014 | $2,736 | $131,020 | $0 | $0 |
Source: Public Records
Map
Nearby Homes
- 1075 Horizon View Blvd
- 1300 Harms Way
- 1086 Donnell Dr
- 1077 Willow Wood Dr
- 1118 Kane Dr
- 1132 Loblolly Ln
- 1057 Azalea Pointe Dr
- 1106 Blueberry Dr
- 1228 Thomasina Dr
- 3830 Bourbon St
- 3852 Bourbon St
- 3859 Calliope Ave
- 1245 Thomas Dr
- 3896 Esplanade Ave
- 1736 Dunlawton Ave
- 1248 Girog Ave
- 3875 Esplanade Ave
- 1175 Tracy Dr
- 993 Appleview Way
- 1166 Tracy Dr
- 1086 Horizon View Blvd
- 1276 Harms Way
- 1278 Harms Way
- 1084 Horizon View Blvd
- 1095 Horizon View Blvd
- 1093 Horizon View Blvd
- 1097 Horizon View Blvd
- 1280 Harms Way
- 1091 Horizon View Blvd
- 1099 Horizon View Blvd
- 1087 Horizon View Blvd
- 1082 Horizon View Blvd
- 1085 Horizon View Blvd
- 1282 Harms Way
- 1083 Horizon View Blvd
- 1080 Horizon View Blvd
- 1081 Horizon View Blvd
- 1284 Harms Way
- 1279 Harms Way