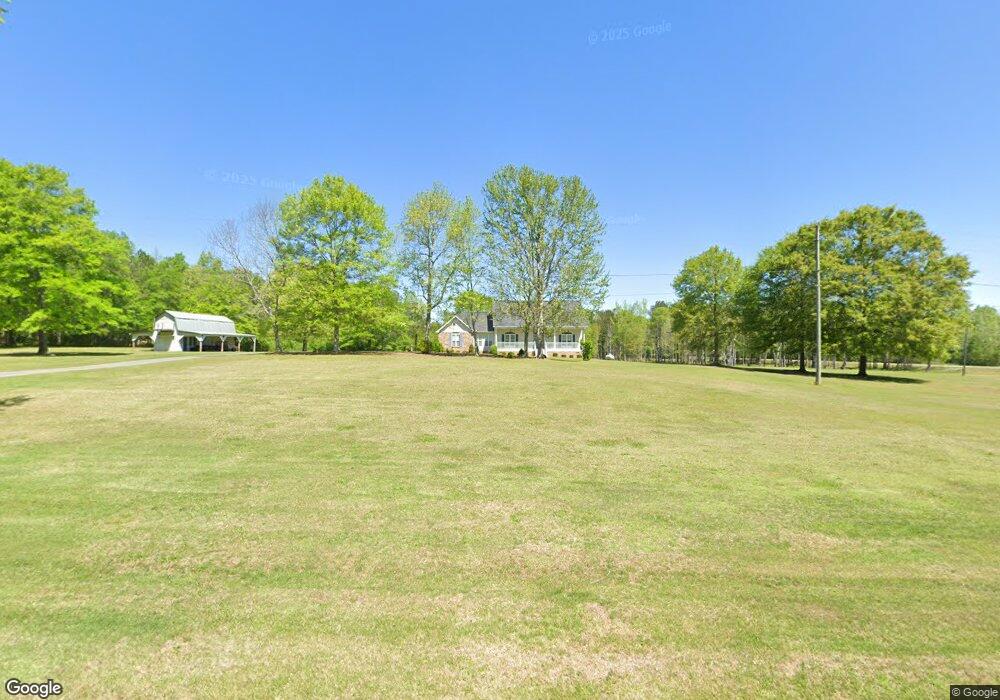
1092 Mote Rd Carrollton, GA 30117
Abilene NeighborhoodEstimated Value: $359,000 - $469,000
3
Beds
2
Baths
1,672
Sq Ft
$239/Sq Ft
Est. Value
About This Home
This home is located at 1092 Mote Rd, Carrollton, GA 30117 and is currently estimated at $399,763, approximately $239 per square foot. 1092 Mote Rd is a home located in Carroll County with nearby schools including Sharp Creek Elementary School, Temple Middle School, and Temple High School.
Ownership History
Date
Name
Owned For
Owner Type
Purchase Details
Closed on
Oct 4, 2023
Sold by
Mcneil Charles Ray
Bought by
Mcneil Lawrence
Current Estimated Value
Purchase Details
Closed on
Jan 8, 2009
Sold by
Mcneil Lawrence
Bought by
Mcneil Charles Ray
Purchase Details
Closed on
Jul 27, 2007
Sold by
Mcneill Lawrence
Bought by
Mcneil Lawrence and Mcneil Lailah B
Home Financials for this Owner
Home Financials are based on the most recent Mortgage that was taken out on this home.
Original Mortgage
$219,900
Interest Rate
6.63%
Mortgage Type
New Conventional
Purchase Details
Closed on
Oct 3, 2006
Sold by
Not Provided
Bought by
Mcneil Charles Ray and Mcneil Kathy P
Purchase Details
Closed on
Sep 6, 2001
Sold by
Cole Randy C
Bought by
Cole Randy C
Purchase Details
Closed on
Sep 5, 2001
Sold by
Cole Randy C and Cole Lucin
Bought by
Cole Randy C
Purchase Details
Closed on
Aug 28, 2000
Sold by
Muse Elsie H Estate
Bought by
Cole Randy C and Cole Lucin
Create a Home Valuation Report for This Property
The Home Valuation Report is an in-depth analysis detailing your home's value as well as a comparison with similar homes in the area
Home Values in the Area
Average Home Value in this Area
Purchase History
| Date | Buyer | Sale Price | Title Company |
|---|---|---|---|
| Mcneil Lawrence | -- | -- | |
| Mcneil Charles Ray | -- | -- | |
| Mcneil Charles Ray | -- | -- | |
| Mcneil Lawrence | -- | -- | |
| Mcneill Lawrence | $219,900 | -- | |
| Mcneil Charles Ray | -- | -- | |
| Cole Randy C | -- | -- | |
| Cole Randy C | -- | -- | |
| Cole Randy C | $59,500 | -- |
Source: Public Records
Mortgage History
| Date | Status | Borrower | Loan Amount |
|---|---|---|---|
| Previous Owner | Mcneill Lawrence | $219,900 |
Source: Public Records
Tax History Compared to Growth
Tax History
| Year | Tax Paid | Tax Assessment Tax Assessment Total Assessment is a certain percentage of the fair market value that is determined by local assessors to be the total taxable value of land and additions on the property. | Land | Improvement |
|---|---|---|---|---|
| 2024 | $3,298 | $145,783 | $26,204 | $119,579 |
| 2023 | $3,298 | $130,399 | $20,964 | $109,435 |
| 2022 | $2,504 | $99,822 | $13,976 | $85,846 |
| 2021 | $2,196 | $85,670 | $11,180 | $74,490 |
| 2020 | $1,931 | $75,225 | $10,164 | $65,061 |
| 2019 | $1,810 | $69,949 | $10,164 | $59,785 |
| 2018 | $1,654 | $62,994 | $9,499 | $53,495 |
| 2017 | $1,659 | $62,994 | $9,499 | $53,495 |
| 2016 | $1,660 | $62,994 | $9,499 | $53,495 |
| 2015 | $2,183 | $78,049 | $18,548 | $59,502 |
| 2014 | $2,192 | $78,050 | $18,548 | $59,502 |
Source: Public Records
Map
Nearby Homes
- 1015 Mote Rd
- 1196 N Highway 113
- 138 Zachary Dr
- 25 Adalee Rd
- 114 Kyle Way
- 0 Center Point Rd Unit TR 3 10274074
- 0 Center Point Rd Unit 7361099
- 85 Mary Ln
- 70 W Meadowcliff Cir
- 70 Henson Cir
- 0 Henson Cir Unit 10584639
- 0 Henson Cir Unit 7632920
- 2930 Hog Liver Rd
- 219 Candlewood Dr
- 45 Buell Jones Rd
- 102 Buell Jones Rd
- 2519 Hog Liver Rd
- 125 Springwood Dr
- 345 Henson Cir