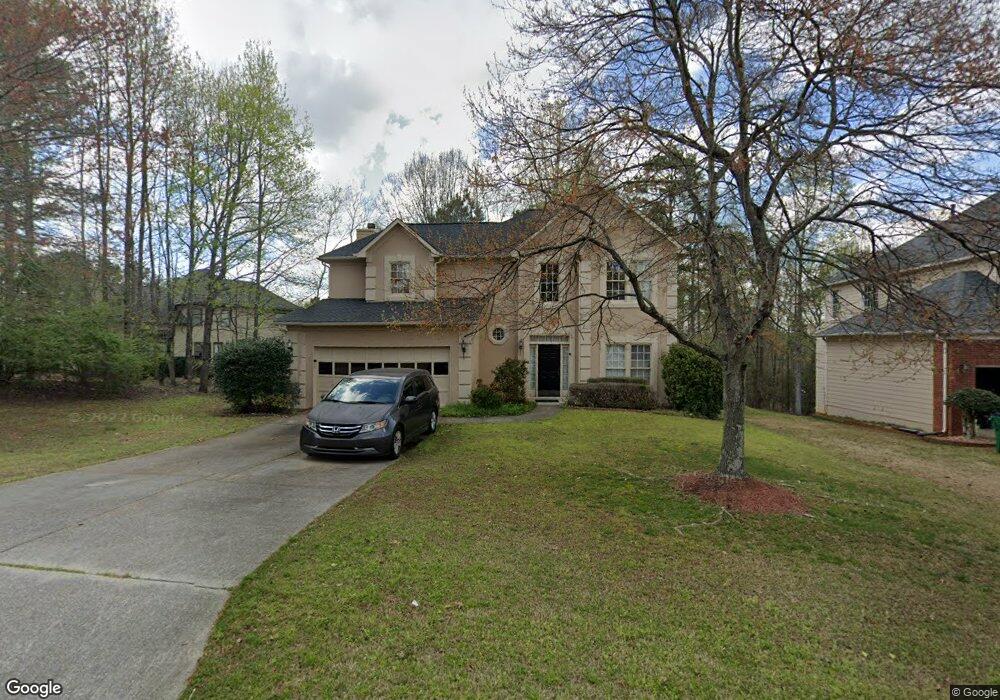
10920 Glenhurst Pass Duluth, GA 30097
Estimated Value: $541,000 - $581,000
3
Beds
3
Baths
1,966
Sq Ft
$285/Sq Ft
Est. Value
About This Home
This home is located at 10920 Glenhurst Pass, Duluth, GA 30097 and is currently estimated at $561,221, approximately $285 per square foot. 10920 Glenhurst Pass is a home located in Fulton County with nearby schools including Wilson Creek Elementary School, River Trail Middle School, and Northview High School.
Ownership History
Date
Name
Owned For
Owner Type
Purchase Details
Closed on
Apr 23, 2015
Sold by
Eskandari Saeed
Bought by
Viswanathan Kaarthigeyen
Current Estimated Value
Home Financials for this Owner
Home Financials are based on the most recent Mortgage that was taken out on this home.
Original Mortgage
$224,000
Outstanding Balance
$172,752
Interest Rate
3.79%
Mortgage Type
New Conventional
Estimated Equity
$388,469
Purchase Details
Closed on
Sep 13, 2000
Sold by
Powers Terry
Bought by
Eskandari Sefeed
Home Financials for this Owner
Home Financials are based on the most recent Mortgage that was taken out on this home.
Original Mortgage
$141,177
Interest Rate
8.05%
Mortgage Type
New Conventional
Purchase Details
Closed on
Aug 28, 1997
Sold by
The Ryland Group Inc
Bought by
Powers Terry
Home Financials for this Owner
Home Financials are based on the most recent Mortgage that was taken out on this home.
Original Mortgage
$144,900
Interest Rate
7.46%
Mortgage Type
New Conventional
Create a Home Valuation Report for This Property
The Home Valuation Report is an in-depth analysis detailing your home's value as well as a comparison with similar homes in the area
Purchase History
We collect this data history from publicly available records. To have your information removed, we recommend requesting removal directly through your county’s website.
| Date | Buyer | Sale Price | Title Company |
|---|---|---|---|
| Viswanathan Kaarthigeyen | $280,000 | -- | |
| Eskandari Sefeed | $188,300 | -- | |
| Powers Terry | $163,900 | -- |
Source: Public Records
Mortgage History
We collect this data history from publicly available records. To have your information removed, we recommend requesting removal directly through your county’s website.
| Date | Status | Borrower | Loan Amount |
|---|---|---|---|
| Open | Viswanathan Kaarthigeyen | $224,000 | |
| Previous Owner | Eskandari Sefeed | $141,177 | |
| Previous Owner | Powers Terry | $144,900 |
Source: Public Records
Tax History
| Year | Tax Paid | Tax Assessment Tax Assessment Total Assessment is a certain percentage of the fair market value that is determined by local assessors to be the total taxable value of land and additions on the property. | Land | Improvement |
|---|---|---|---|---|
| 2025 | $5,311 | $188,760 | $57,800 | $130,960 |
| 2023 | $5,328 | $188,760 | $57,800 | $130,960 |
| 2022 | $4,659 | $151,840 | $43,200 | $108,640 |
| 2021 | $3,795 | $120,440 | $30,160 | $90,280 |
| 2020 | $3,832 | $119,040 | $29,800 | $89,240 |
| 2019 | $478 | $121,240 | $31,600 | $89,640 |
| 2018 | $3,857 | $118,440 | $30,880 | $87,560 |
| 2017 | $3,812 | $112,000 | $26,160 | $85,840 |
| 2016 | $3,757 | $112,000 | $26,160 | $85,840 |
| 2015 | $2,898 | $97,880 | $22,880 | $75,000 |
| 2014 | -- | $97,880 | $22,880 | $75,000 |
Source: Public Records
Map
Nearby Homes
- 10595 Highgate Manor Ct
- 6053 Galewind Ct
- 10464 Holliwell Ct
- 3052 Brindale Dr
- 4259 Baden Aly
- 10015 Ruppel Ln
- 10005 Ruppel Ln
- 10025 Ruppel Ln
- 11000 Abbotts Station Dr
- 6142 Deluna Way
- 11007 Lorin Way
- 11057 Lorin Way
- 6180 Briggs Way
- 10995 Parsons Rd
- 6108 Joybrook Rd
- 10635 Stonefield Landing Unit 1
- 11105 Abbotts Station Dr
- 850 Lake Medlock Dr
- 11120 Abbotts Station Dr
- 10590 Stonepoint Place Unit 1
- 10930 Glenhurst Pass
- 325 Victorian Ln
- 315 Victorian Ln
- 305 Victorian Ln
- 10940 Glenhurst Pass
- 335 Victorian Ln Unit 77
- 335 Victorian Ln
- 10885 Glenhurst Pass
- 10895 Glenhurst Pass
- 10875 Glenhurst Pass
- 10905 Glenhurst Pass
- 610 Glenarbor Dr
- 345 Victorian Ln
- 620 Glenarbor Dr
- 10915 Glenhurst Pass
- 580 Dorchester Crossing
- 330 Victorian Ln
- 585 Dorchester Crossing
- 320 Victorian Ln
- 270 Windsor Chase Trail
Your Personal Tour Guide
Ask me questions while you tour the home.