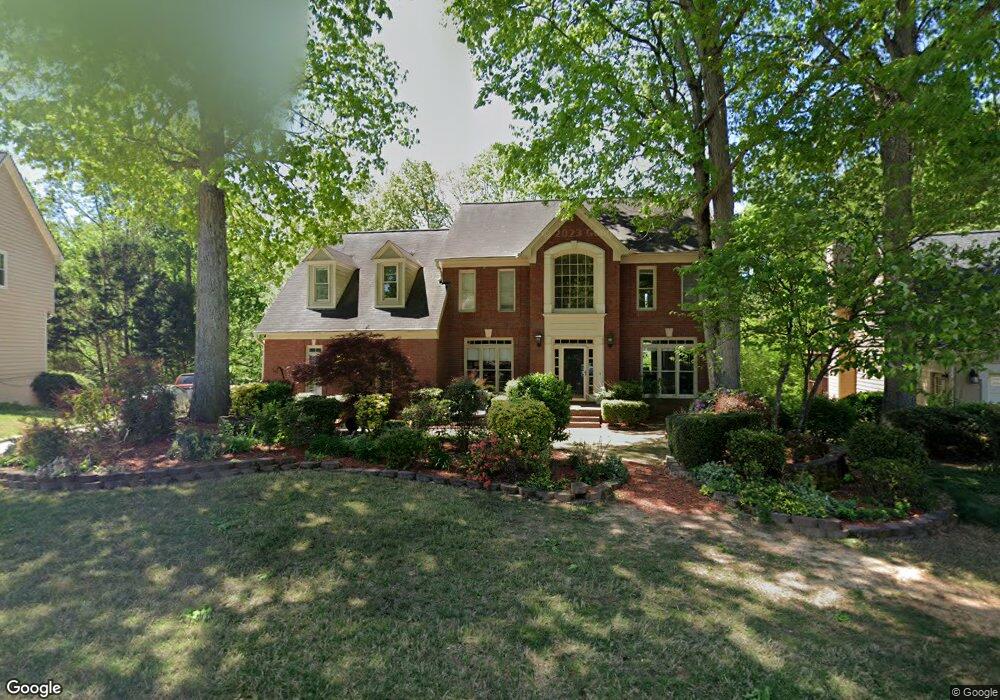
10920 Pennbrooke Crossing Unit CRS Duluth, GA 30097
Estimated Value: $691,000 - $733,000
4
Beds
3
Baths
2,758
Sq Ft
$257/Sq Ft
Est. Value
About This Home
This home is located at 10920 Pennbrooke Crossing Unit CRS, Duluth, GA 30097 and is currently estimated at $707,562, approximately $256 per square foot. 10920 Pennbrooke Crossing Unit CRS is a home located in Fulton County with nearby schools including Shakerag Elementary School, River Trail Middle School, and Northview High School.
Ownership History
Date
Name
Owned For
Owner Type
Purchase Details
Closed on
Mar 29, 2001
Sold by
Blythe Paul J and Blythe Inge
Bought by
Lucas Grant D and Lucas Mala E
Current Estimated Value
Home Financials for this Owner
Home Financials are based on the most recent Mortgage that was taken out on this home.
Original Mortgage
$186,000
Outstanding Balance
$68,567
Interest Rate
7.02%
Mortgage Type
New Conventional
Estimated Equity
$638,995
Purchase Details
Closed on
Aug 23, 1996
Sold by
Black Richard W Terri M
Bought by
Blythe Paul J Inge
Purchase Details
Closed on
Jun 24, 1994
Sold by
Clark Kennth R Michele A
Bought by
Black Richard W Terri M
Home Financials for this Owner
Home Financials are based on the most recent Mortgage that was taken out on this home.
Original Mortgage
$150,000
Interest Rate
8.28%
Create a Home Valuation Report for This Property
The Home Valuation Report is an in-depth analysis detailing your home's value as well as a comparison with similar homes in the area
Home Values in the Area
Average Home Value in this Area
Purchase History
| Date | Buyer | Sale Price | Title Company |
|---|---|---|---|
| Lucas Grant D | $286,000 | -- | |
| Blythe Paul J Inge | $214,500 | -- | |
| Black Richard W Terri M | $212,000 | -- |
Source: Public Records
Mortgage History
| Date | Status | Borrower | Loan Amount |
|---|---|---|---|
| Open | Lucas Grant D | $186,000 | |
| Previous Owner | Black Richard W Terri M | $150,000 | |
| Closed | Blythe Paul J Inge | $0 |
Source: Public Records
Tax History Compared to Growth
Tax History
| Year | Tax Paid | Tax Assessment Tax Assessment Total Assessment is a certain percentage of the fair market value that is determined by local assessors to be the total taxable value of land and additions on the property. | Land | Improvement |
|---|---|---|---|---|
| 2025 | $4,165 | $256,840 | $81,480 | $175,360 |
| 2023 | $7,075 | $250,640 | $63,480 | $187,160 |
| 2022 | $3,996 | $197,680 | $46,680 | $151,000 |
| 2021 | $3,942 | $155,360 | $51,960 | $103,400 |
| 2020 | $3,974 | $167,400 | $62,520 | $104,880 |
| 2019 | $492 | $146,520 | $30,760 | $115,760 |
| 2018 | $4,012 | $143,080 | $30,040 | $113,040 |
| 2017 | $3,912 | $131,840 | $29,120 | $102,720 |
| 2016 | $3,829 | $131,840 | $29,120 | $102,720 |
| 2015 | $3,870 | $131,840 | $29,120 | $102,720 |
| 2014 | $3,221 | $104,360 | $23,080 | $81,280 |
Source: Public Records
Map
Nearby Homes
- 11100 Crofton Overlook Ct Unit 2
- 260 Ketton Downs
- 120 Croftwood Ct
- 951 Olmsted Ln
- 10635 N Edgewater Place
- 345 Wiman Park Ln
- 7685 Settles Walk Ln
- 828 Olmsted Ln
- 7315 Craigleith Dr
- 7067 Walham Grove
- 955 Gardiner Cir
- 7405 Ledgewood Way
- 6879 Downs Ave
- 1020 Grace Ct
- 10792 Glenleigh Dr Unit 5B2
- 7520 Ledgewood Way
- 10723 Glenleigh Dr
- 11100 Brookhavenclub Dr
- 10930 Pennbrooke Crossing
- 10910 Pennbrooke Crossing
- 0 Pennbrooke Crossing Unit 7565830
- 0 Pennbrooke Crossing Unit 7437417
- 0 Pennbrooke Crossing Unit 7198262
- 0 Pennbrooke Crossing Unit 8795359
- 0 Pennbrooke Crossing Unit 8645990
- 0 Pennbrooke Crossing Unit 8591873
- 0 Pennbrooke Crossing Unit 8441209
- 0 Pennbrooke Crossing Unit 8388744
- 0 Pennbrooke Crossing Unit 8234833
- 0 Pennbrooke Crossing Unit 7562502
- 0 Pennbrooke Crossing Unit 3216033
- 0 Pennbrooke Crossing Unit 3133173
- 10940 Pennbrooke Crossing
- 10900 Pennbrooke Crossing
- 280 Amberton Ct Unit 3
- 10935 Pennbrooke Crossing
- 275 Amberton Ct
- 10945 Pennbrooke Crossing