10925 NE 64th St Kirkland, WA 98033
Central Houghton NeighborhoodEstimated Value: $1,529,000 - $2,115,000
4
Beds
3
Baths
2,340
Sq Ft
$808/Sq Ft
Est. Value
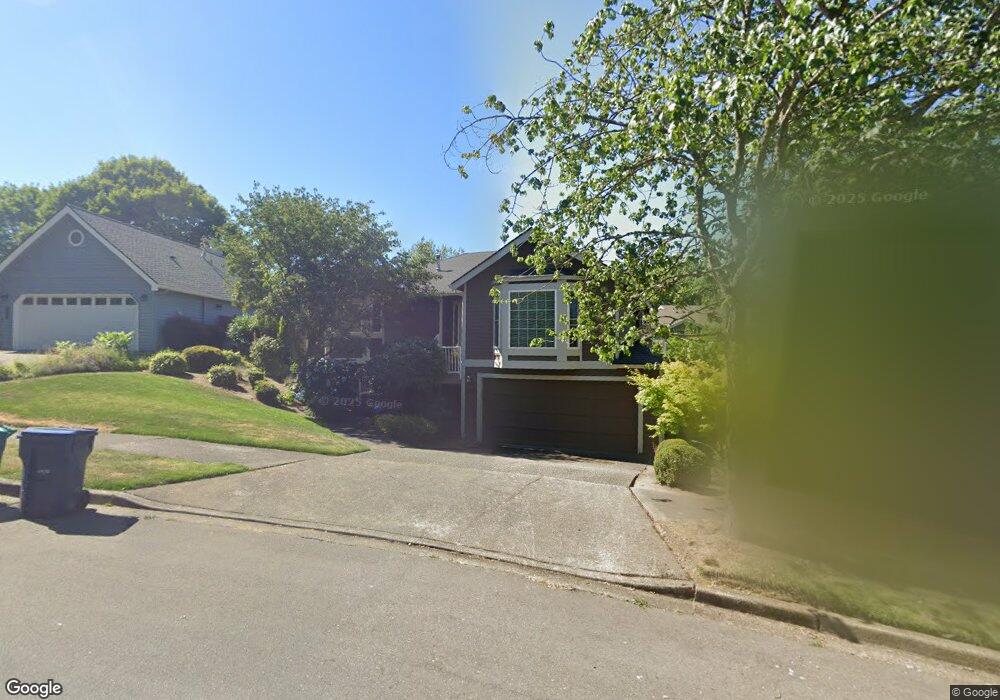
About This Home
This home is located at 10925 NE 64th St, Kirkland, WA 98033 and is currently estimated at $1,891,146, approximately $808 per square foot. 10925 NE 64th St is a home located in King County with nearby schools including Lakeview Elementary School, Kirkland Middle School, and Lake Washington High School.
Ownership History
Date
Name
Owned For
Owner Type
Purchase Details
Closed on
Apr 22, 2021
Sold by
Laursen Ross Allan
Bought by
Laursen Dana Steves
Current Estimated Value
Purchase Details
Closed on
Feb 2, 2012
Sold by
Laursen Ross A and Laursen Dana S
Bought by
Laursen Ross A and Laursen Dana S
Purchase Details
Closed on
Feb 11, 2002
Sold by
Bouillon Michael D and Bouillon Donna H
Bought by
Laursen Ross A and Laursen Dana S
Home Financials for this Owner
Home Financials are based on the most recent Mortgage that was taken out on this home.
Original Mortgage
$260,000
Outstanding Balance
$105,529
Interest Rate
6.8%
Estimated Equity
$1,785,617
Purchase Details
Closed on
Nov 24, 1998
Sold by
Pratt Gary A and Pratt Teri A
Bought by
Bouillon Michael D and Bouillon Donna H
Home Financials for this Owner
Home Financials are based on the most recent Mortgage that was taken out on this home.
Original Mortgage
$264,000
Interest Rate
6.84%
Create a Home Valuation Report for This Property
The Home Valuation Report is an in-depth analysis detailing your home's value as well as a comparison with similar homes in the area
Home Values in the Area
Average Home Value in this Area
Purchase History
| Date | Buyer | Sale Price | Title Company |
|---|---|---|---|
| Laursen Dana Steves | -- | None Available | |
| Laursen Ross A | -- | None Available | |
| Laursen Ross A | $437,000 | Chicago Title | |
| Bouillon Michael D | $390,000 | Transnation Title Insurance |
Source: Public Records
Mortgage History
| Date | Status | Borrower | Loan Amount |
|---|---|---|---|
| Open | Laursen Ross A | $260,000 | |
| Previous Owner | Bouillon Michael D | $264,000 |
Source: Public Records
Tax History Compared to Growth
Tax History
| Year | Tax Paid | Tax Assessment Tax Assessment Total Assessment is a certain percentage of the fair market value that is determined by local assessors to be the total taxable value of land and additions on the property. | Land | Improvement |
|---|---|---|---|---|
| 2024 | $13,854 | $1,707,000 | $966,000 | $741,000 |
| 2023 | $12,939 | $1,511,000 | $885,000 | $626,000 |
| 2022 | $11,391 | $1,822,000 | $1,070,000 | $752,000 |
| 2021 | $10,423 | $1,278,000 | $755,000 | $523,000 |
| 2020 | $10,036 | $1,074,000 | $649,000 | $425,000 |
| 2018 | $8,922 | $1,023,000 | $637,000 | $386,000 |
| 2017 | $7,537 | $876,000 | $572,000 | $304,000 |
| 2016 | $7,038 | $770,000 | $509,000 | $261,000 |
| 2015 | $6,710 | $709,000 | $477,000 | $232,000 |
| 2014 | -- | $651,000 | $485,000 | $166,000 |
| 2013 | -- | $536,000 | $441,000 | $95,000 |
Source: Public Records
Map
Nearby Homes
- 6511 108th Ave NE Unit 3
- 10615 NE 65th Ln
- 11104 NE 68th St Unit A103
- 11216 NE 67th St Unit 4
- 11218 NE 67th St Unit 3
- 11231 NE 67th St
- 6210 105th Ave NE
- 10602 NE 60th St
- 725 9th Ave S Unit 202
- 11226 NE 67th St
- 5906 112th Place NE
- 5837 112th Place NE
- 5829 112th Place NE
- 11228 NE 68th St Unit A
- 11344 NE 67th St Unit A1
- 6211 116th Ave NE
- 5515 108th Ave NE
- 10410 NE 58th St
- 10218 NE 65th St
- 332 10th Ave S
- 10917 NE 64th St
- 11003 NE 64th St
- 6308 110th Ave NE
- 6304 110th Ave NE
- 10905 NE 64th St
- 11009 NE 64th St
- 10928 NE 64th St
- 6320 110th Ave NE
- 6230 110th Ave NE
- 10903 NE 64th St
- 11015 NE 64th St
- 10834 NE 64th St
- 10831 NE 64th St
- 6226 110th Ave NE
- 6321 110th Ave NE
- 11014 NE 64th St
- 6314 108th Ave NE
- 6307 110th Ave NE
- 6215 110th Ave NE