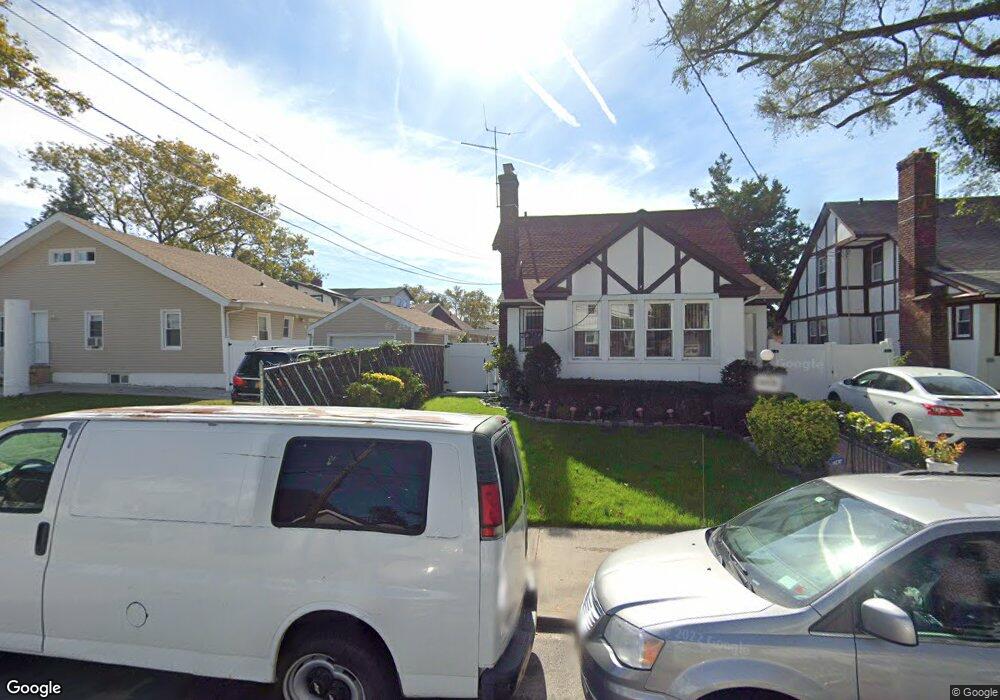
10926 Rye Place Saint Albans, NY 11412
Hollis NeighborhoodEstimated Value: $543,000 - $726,000
--
Bed
--
Bath
1,249
Sq Ft
$491/Sq Ft
Est. Value
About This Home
This home is located at 10926 Rye Place, Saint Albans, NY 11412 and is currently estimated at $612,888, approximately $490 per square foot. 10926 Rye Place is a home located in Queens County with nearby schools including P.S. 118 Lorraine Hansberry, I.S. 192 The Linden, and True Deliverance Christian School.
Ownership History
Date
Name
Owned For
Owner Type
Purchase Details
Closed on
Jun 1, 2021
Sold by
Piquant Frantz and Piquant Natalie
Bought by
Piquant Frantz
Current Estimated Value
Home Financials for this Owner
Home Financials are based on the most recent Mortgage that was taken out on this home.
Original Mortgage
$383,646
Outstanding Balance
$353,735
Interest Rate
4.16%
Mortgage Type
Purchase Money Mortgage
Estimated Equity
$259,153
Purchase Details
Closed on
Jun 10, 1998
Sold by
Baker Juliet
Bought by
Piquant Franz and Piquant Natalie
Home Financials for this Owner
Home Financials are based on the most recent Mortgage that was taken out on this home.
Original Mortgage
$168,900
Interest Rate
6.92%
Mortgage Type
FHA
Purchase Details
Closed on
Jul 30, 1997
Sold by
Baker Lindsay I and Baker Juliet
Bought by
Baker Juliet
Create a Home Valuation Report for This Property
The Home Valuation Report is an in-depth analysis detailing your home's value as well as a comparison with similar homes in the area
Home Values in the Area
Average Home Value in this Area
Purchase History
| Date | Buyer | Sale Price | Title Company |
|---|---|---|---|
| Piquant Frantz | -- | -- | |
| Piquant Frantz | -- | -- | |
| Piquant Franz | $175,000 | Commonwealth Land Title Ins | |
| Piquant Franz | $175,000 | Commonwealth Land Title Ins | |
| Baker Juliet | -- | -- | |
| Baker Juliet | -- | -- |
Source: Public Records
Mortgage History
| Date | Status | Borrower | Loan Amount |
|---|---|---|---|
| Open | Piquant Frantz | $383,646 | |
| Closed | Piquant Frantz | $383,646 | |
| Previous Owner | Piquant Franz | $168,900 |
Source: Public Records
Tax History Compared to Growth
Tax History
| Year | Tax Paid | Tax Assessment Tax Assessment Total Assessment is a certain percentage of the fair market value that is determined by local assessors to be the total taxable value of land and additions on the property. | Land | Improvement |
|---|---|---|---|---|
| 2025 | $5,552 | $29,140 | $8,716 | $20,424 |
| 2024 | $5,564 | $29,042 | $8,164 | $20,878 |
| 2023 | $5,237 | $27,475 | $8,549 | $18,926 |
| 2022 | $5,078 | $34,860 | $12,060 | $22,800 |
| 2021 | $5,121 | $32,460 | $12,060 | $20,400 |
| 2020 | $4,844 | $27,900 | $12,060 | $15,840 |
| 2019 | $4,770 | $28,740 | $12,060 | $16,680 |
| 2018 | $4,370 | $22,896 | $10,004 | $12,892 |
| 2017 | $4,265 | $22,394 | $11,169 | $11,225 |
| 2016 | $3,978 | $22,394 | $11,169 | $11,225 |
| 2015 | $2,328 | $20,236 | $9,874 | $10,362 |
| 2014 | $2,328 | $20,169 | $11,774 | $8,395 |
Source: Public Records
Map
Nearby Homes
- 188-31 Jordan Ave
- 186-16 Hilburn Ave
- 187-44 Jordan Ave
- 111-06 Farmers Blvd
- 187-23 Brinkerhoff Ave
- 188-25 Mangin Ave
- 18823 Mangin Ave
- 188-07 Mangin Ave
- 183-34 Fonda Ave
- 18833 Keeseville Ave
- 183-29 Brinkerhoff Ave
- 10533 Farmers Blvd
- 19022 111th Rd
- 183-67 Dunlop Ave
- 19027 109th Rd
- 183-12 Elmira Ave
- 10532 192nd St
- 183-09 Dunlop Ave
- 104-11 188th St
- 193-21 109th Rd
- 10918 Rye Place
- 18715 Hilburn Ave
- 18709 Hilburn Ave
- 187-09 Hilburn Ave
- 10931 Hannibal St
- 109-31 Hannibal St
- 18606 Galway Ave
- 187-15 Hilburn Ave
- 18705 Hilburn Ave
- 10929 Rye Place
- 10925 Rye Place
- 109-29 Rye Place
- 10915 Rye Place
- 109-15 Rye Place
- 10911 Rye Place
- 10911 Rye Place
- 10933 Rye Place
- 10919 Hannibal St
- 10909 Rye Place
- 18620 Brinkerhoff Ave