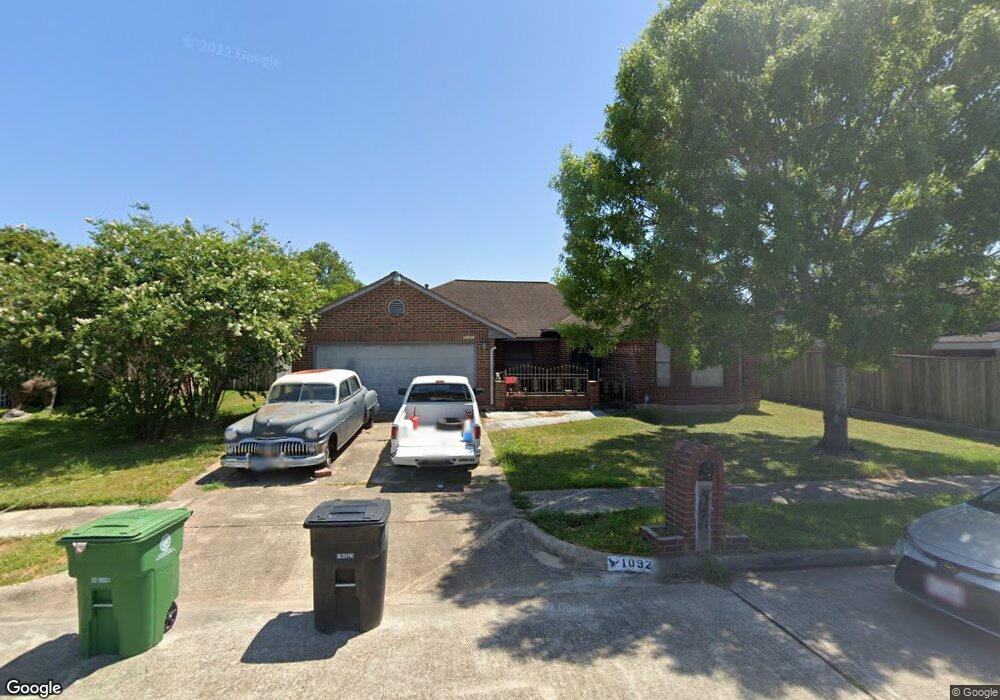
10927 Cedar Bridge Houston, TX 77075
Southbelt-Ellington NeighborhoodEstimated Value: $264,000 - $281,000
4
Beds
2
Baths
1,821
Sq Ft
$149/Sq Ft
Est. Value
About This Home
This home is located at 10927 Cedar Bridge, Houston, TX 77075 and is currently estimated at $271,369, approximately $149 per square foot. 10927 Cedar Bridge is a home located in Harris County with nearby schools including Atkinson Elementary School, Morris Middle School, and Beverly Hill Intermediate School.
Ownership History
Date
Name
Owned For
Owner Type
Purchase Details
Closed on
May 31, 2005
Sold by
Franks Linda Gonzales
Bought by
Franks Wilburn Royce and Franks Linda Gonzales
Current Estimated Value
Purchase Details
Closed on
Sep 19, 1997
Sold by
Franks Milburn Joyce and Franks Carolyn
Bought by
Franks Wilburn Joyce and Franks Linda Gonzales
Purchase Details
Closed on
Nov 16, 1994
Sold by
Larkstone Building Company
Bought by
Franks Otto Lee and Gonzales Rafael F
Home Financials for this Owner
Home Financials are based on the most recent Mortgage that was taken out on this home.
Original Mortgage
$86,452
Interest Rate
8.88%
Mortgage Type
FHA
Purchase Details
Closed on
Jul 6, 1994
Sold by
Parkstone Building Company
Bought by
Larkstone Building Company
Create a Home Valuation Report for This Property
The Home Valuation Report is an in-depth analysis detailing your home's value as well as a comparison with similar homes in the area
Home Values in the Area
Average Home Value in this Area
Purchase History
| Date | Buyer | Sale Price | Title Company |
|---|---|---|---|
| Franks Wilburn Royce | -- | -- | |
| Franks Wilburn Joyce | -- | -- | |
| Franks Otto Lee | -- | Stewart Title | |
| Larkstone Building Company | -- | -- |
Source: Public Records
Mortgage History
| Date | Status | Borrower | Loan Amount |
|---|---|---|---|
| Previous Owner | Franks Otto Lee | $86,452 |
Source: Public Records
Tax History Compared to Growth
Tax History
| Year | Tax Paid | Tax Assessment Tax Assessment Total Assessment is a certain percentage of the fair market value that is determined by local assessors to be the total taxable value of land and additions on the property. | Land | Improvement |
|---|---|---|---|---|
| 2025 | $182 | $264,145 | $53,914 | $210,231 |
| 2024 | $182 | $258,193 | $44,479 | $213,714 |
| 2023 | $182 | $270,479 | $44,479 | $226,000 |
| 2022 | $5,585 | $246,248 | $44,479 | $201,769 |
| 2021 | $5,328 | $214,943 | $44,479 | $170,464 |
| 2020 | $4,942 | $194,436 | $40,435 | $154,001 |
| 2019 | $4,725 | $190,587 | $37,066 | $153,521 |
| 2018 | $30 | $149,000 | $28,642 | $120,358 |
| 2017 | $4,448 | $170,309 | $28,642 | $141,667 |
| 2016 | $4,044 | $146,829 | $23,587 | $123,242 |
| 2015 | $554 | $135,857 | $23,587 | $112,270 |
| 2014 | $554 | $125,186 | $23,587 | $101,599 |
Source: Public Records
Map
Nearby Homes
- 10906 Stover St
- 9411 Kingsvalley St
- 9407 Kingspass St
- 9423 Garden Bridge St
- 9303 Kingsflower Cir
- 9610 Sumerlin St
- 9721 Foredale St
- 9602 Sumerlin St
- 10610 Stover St
- 9914 Sumerlin St
- 10018 Ramey St
- 9115 Kingsrose Ln
- 9711 Ebb St
- 10831 Cayman Mist Dr
- 10410 Stover St
- 9319 Canady Park Ln
- 10827 Linden Gate Dr
- 11019 Cayman Mist Dr
- 10918 Linden Gate Dr
- 9811 Mango St
- 10923 Cedar Bridge
- 9555 Carmalee St
- 9559 Carmalee St
- 10919 Cedar Bridge
- 9546 Coast Bridge St
- 9547 Carmalee St
- 10915 Cedar Bridge
- 9542 Coast Bridge St
- 9547 Coast Bridge St
- 9543 Carmalee St
- 9554 Carmalee St
- 10926 Stover St
- 9558 Carmalee St
- 10930 Stover St
- 9543 Coast Bridge St
- 9538 Coast Bridge St
- 9550 Carmalee St
- 10922 Stover St
- 9539 Carmalee St
- 9562 Carmalee St