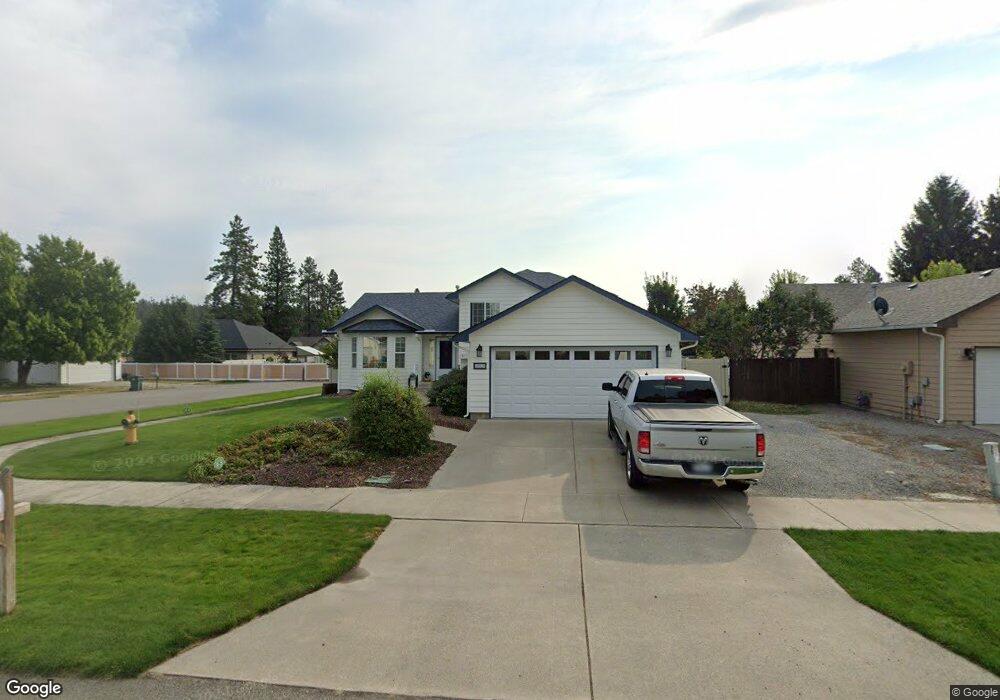
10928 N Joshua Ct Hayden, ID 83835
Estimated Value: $528,000 - $552,000
3
Beds
3
Baths
1,628
Sq Ft
$332/Sq Ft
Est. Value
About This Home
This home is located at 10928 N Joshua Ct, Hayden, ID 83835 and is currently estimated at $540,208, approximately $331 per square foot. 10928 N Joshua Ct is a home located in Kootenai County with nearby schools including Hayden Meadows Elementary School, Canfield Middle School, and Coeur d'Alene High School.
Ownership History
Date
Name
Owned For
Owner Type
Purchase Details
Closed on
Jul 26, 2022
Sold by
Neese Daniel L and Neese Yolande C
Bought by
Daniel And Yolande Neese Living Trust
Current Estimated Value
Purchase Details
Closed on
Oct 17, 2008
Sold by
Carter Cynthia Ann and Woods Cynthia A
Bought by
Neese Daniel L and Neese Yolande C
Home Financials for this Owner
Home Financials are based on the most recent Mortgage that was taken out on this home.
Original Mortgage
$204,282
Interest Rate
6.31%
Mortgage Type
FHA
Purchase Details
Closed on
Oct 7, 2008
Sold by
Whitesitt Ronald W
Bought by
Carter Cynthia Ann and Woods Cynthia A
Home Financials for this Owner
Home Financials are based on the most recent Mortgage that was taken out on this home.
Original Mortgage
$204,282
Interest Rate
6.31%
Mortgage Type
FHA
Create a Home Valuation Report for This Property
The Home Valuation Report is an in-depth analysis detailing your home's value as well as a comparison with similar homes in the area
Home Values in the Area
Average Home Value in this Area
Purchase History
| Date | Buyer | Sale Price | Title Company |
|---|---|---|---|
| Daniel And Yolande Neese Living Trust | -- | None Listed On Document | |
| Neese Daniel L | -- | First American Title Co | |
| Carter Cynthia Ann | -- | First American Title Com |
Source: Public Records
Mortgage History
| Date | Status | Borrower | Loan Amount |
|---|---|---|---|
| Previous Owner | Neese Daniel L | $204,282 |
Source: Public Records
Tax History Compared to Growth
Tax History
| Year | Tax Paid | Tax Assessment Tax Assessment Total Assessment is a certain percentage of the fair market value that is determined by local assessors to be the total taxable value of land and additions on the property. | Land | Improvement |
|---|---|---|---|---|
| 2024 | $1,551 | $488,970 | $175,000 | $313,970 |
| 2023 | $1,551 | $509,669 | $180,000 | $329,669 |
| 2022 | $1,933 | $564,205 | $200,000 | $364,205 |
| 2021 | $1,648 | $353,058 | $125,000 | $228,058 |
| 2020 | $1,659 | $302,324 | $100,000 | $202,324 |
| 2019 | $1,610 | $280,135 | $96,800 | $183,335 |
| 2018 | $1,484 | $247,470 | $88,000 | $159,470 |
| 2017 | $1,313 | $220,700 | $65,000 | $155,700 |
| 2016 | $2,246 | $205,060 | $57,500 | $147,560 |
| 2015 | $2,172 | $193,600 | $46,000 | $147,600 |
| 2013 | $2,028 | $168,430 | $36,800 | $131,630 |
Source: Public Records
Map
Nearby Homes
- 11042 N Cattle Dr
- 11074 N Cattle Dr
- 10589 N Crimson Dr
- 724 E Arena Loop
- 222 E Lobo Loop
- 218 E Lobo Loop
- 228 E Lobo Loop
- 236 E Lobo Loop
- 244 E Lobo Loop
- 254 E Lobo Loop
- 11551 N Beryl Dr
- 206 E Lobo Loop
- 198 E Lobo Loop
- 450 E Miles Ave
- 11423 Greentree
- 11388 N Armonia Way
- 11363 N Armonia Way
- 176 E Maryanna Ln
- 10293 Cedar Ct
- 1359 E Ezra Ave
- 10906 N Joshua Ct
- 10884 N Joshua Ct
- 10911 N Joshua Ct
- 10911 N Joshua Ct
- 10983 N Joshua Ct
- 10933 N Joshua Ct
- 10889 N Joshua Ct
- 11005 N Joshua Ct
- 10909 N Rocking r Rd
- 10951 N Joshua Ct
- 10945 N Rocking r Rd
- 10889 N Joshua Ct
- 10973 N Joshua Ct
- 10860 N Joshua Ct
- 10867 N Joshua Ct
- 10965 N Joshua Ct
- 10871 N Rocking r Rd
- 10981 N Rocking r Rd
- 0 N Joshua Ct
- 785 E Lacey Ave