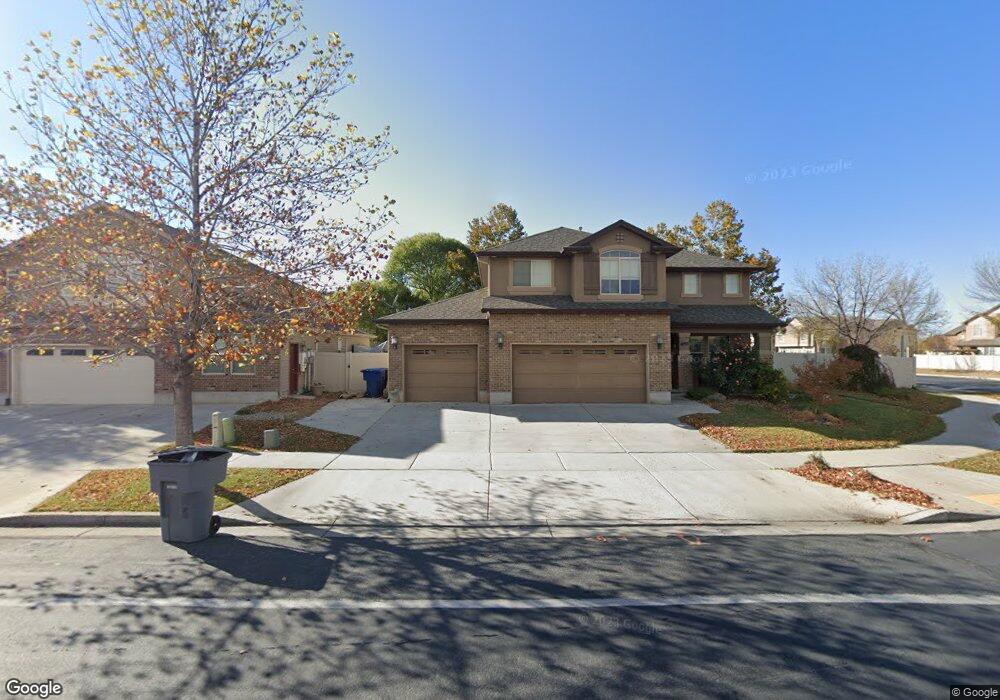
1093 N Fox Hollow Dr North Salt Lake, UT 84054
Estimated Value: $624,000 - $701,000
4
Beds
3
Baths
2,600
Sq Ft
$249/Sq Ft
Est. Value
About This Home
This home is located at 1093 N Fox Hollow Dr, North Salt Lake, UT 84054 and is currently estimated at $646,571, approximately $248 per square foot. 1093 N Fox Hollow Dr is a home located in Davis County with nearby schools including Foxboro School, Mueller Park Junior High School, and Bountiful High School.
Ownership History
Date
Name
Owned For
Owner Type
Purchase Details
Closed on
Mar 1, 2023
Sold by
Litchfield Chase
Bought by
1093 N Fox Hollow Llc
Current Estimated Value
Purchase Details
Closed on
Dec 22, 2017
Sold by
Litchfield Chase and Knudsen Michael D
Bought by
Litchfield Chase and Burton Shandra
Home Financials for this Owner
Home Financials are based on the most recent Mortgage that was taken out on this home.
Original Mortgage
$296,000
Interest Rate
3.95%
Mortgage Type
New Conventional
Purchase Details
Closed on
Mar 22, 2016
Sold by
Litchfield Chase
Bought by
Litchfield Chase and Knudsen Michael D
Purchase Details
Closed on
Jan 11, 2012
Sold by
Smith Candice K
Bought by
Knudsen Michael D
Purchase Details
Closed on
Oct 29, 2007
Sold by
Woodside Amberly Llc
Bought by
Knudsen Michael D and Smith Candice K
Home Financials for this Owner
Home Financials are based on the most recent Mortgage that was taken out on this home.
Original Mortgage
$317,632
Interest Rate
6.36%
Mortgage Type
Purchase Money Mortgage
Purchase Details
Closed on
May 25, 2007
Sold by
Portola Development Utah Lc
Bought by
Woodside Amberly Llc
Create a Home Valuation Report for This Property
The Home Valuation Report is an in-depth analysis detailing your home's value as well as a comparison with similar homes in the area
Home Values in the Area
Average Home Value in this Area
Purchase History
| Date | Buyer | Sale Price | Title Company |
|---|---|---|---|
| 1093 N Fox Hollow Llc | -- | -- | |
| Litchfield Chase | -- | C&R Title | |
| Litchfield Chase | -- | -- | |
| Knudsen Michael D | -- | Title One Inc | |
| Knudsen Michael D | -- | Us Title Company Of Utah | |
| Woodside Amberly Llc | -- | None Available |
Source: Public Records
Mortgage History
| Date | Status | Borrower | Loan Amount |
|---|---|---|---|
| Previous Owner | Litchfield Chase | $296,000 | |
| Previous Owner | Knudsen Michael D | $317,632 |
Source: Public Records
Tax History Compared to Growth
Tax History
| Year | Tax Paid | Tax Assessment Tax Assessment Total Assessment is a certain percentage of the fair market value that is determined by local assessors to be the total taxable value of land and additions on the property. | Land | Improvement |
|---|---|---|---|---|
| 2025 | $3,160 | $327,250 | $106,110 | $221,140 |
| 2024 | $3,160 | $317,899 | $113,132 | $204,767 |
| 2023 | $2,975 | $297,550 | $82,430 | $215,119 |
| 2022 | $3,257 | $311,301 | $65,137 | $246,164 |
| 2021 | $2,825 | $428,000 | $96,682 | $331,318 |
| 2020 | $2,530 | $379,000 | $82,241 | $296,759 |
| 2019 | $2,655 | $388,000 | $61,925 | $326,075 |
| 2018 | $2,546 | $368,000 | $56,296 | $311,704 |
| 2016 | $2,354 | $180,950 | $30,963 | $149,987 |
| 2015 | $2,243 | $165,660 | $30,963 | $134,697 |
| 2014 | $1,878 | $141,405 | $30,963 | $110,442 |
| 2013 | -- | $142,769 | $30,878 | $111,891 |
Source: Public Records
Map
Nearby Homes
- 1052 Chidester Dr
- 997 N Fox Hollow Dr
- 1150 Wiltshire Dr
- 1147 Abbotsford Dr
- 1022 Allington Dr
- 1074 Allington Dr
- 997 Amberly Dr
- 967 Amberly Dr
- 1147 Ethnie Ct
- 1002 W Stonehaven Dr Unit 108
- 928 Amberly Dr
- 1072 W Stonehaven Dr
- 940 W Stonehaven Dr
- 942 N Abbey Dr
- 920 W Stonehaven Dr
- Somerset B Plan at Clifton Place Townhomes
- Somerset A Plan at Clifton Place Townhomes
- Camden Plan at Clifton Place Townhomes
- Charleston Plan at Clifton Place Townhomes
- Kensington Plan at Clifton Place Townhomes
- 1087 N Fox Hollow Dr
- 1096 Chidester Dr
- 1084 Chidester Dr
- 1074 Chidester Dr
- 1073 N Fox Hollow Dr
- 1068 Chidester Dr
- 1094 N Fox Hollow Dr
- 1088 N Fox Hollow Dr
- 1062 Chidester Dr
- 1037 Castleton Dr
- 1037 Castleton Dr Unit 1331
- 1045 Castleton Dr
- 1061 N Fox Hollow Dr
- 1074 N Fox Hollow Dr
- 1053 Castleton Dr
- 1053 Castleton Dr Unit 131-4
- 1031 Castleton Dr
- 1031 Castleton Dr Unit 1333
- 1035 Castleton Dr
- 1035 Castleton Dr Unit 1332