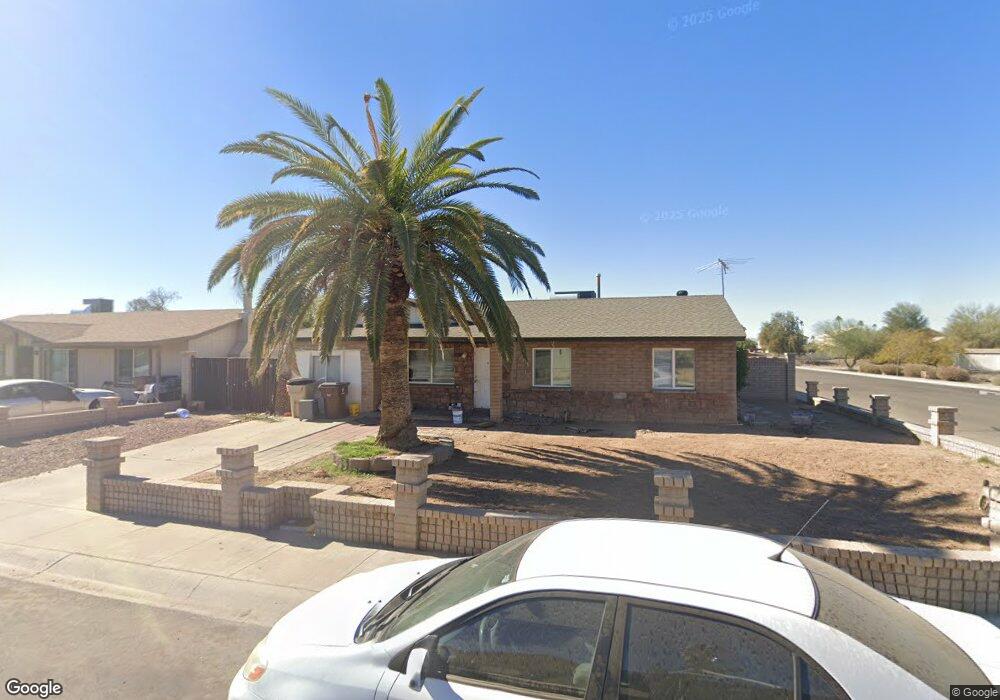
10932 N 88th Dr Peoria, AZ 85345
Estimated Value: $275,000 - $331,000
3
Beds
2
Baths
1,075
Sq Ft
$273/Sq Ft
Est. Value
About This Home
This home is located at 10932 N 88th Dr, Peoria, AZ 85345 and is currently estimated at $293,254, approximately $272 per square foot. 10932 N 88th Dr is a home located in Maricopa County with nearby schools including Sun Valley Elementary School, Peoria High School, and Peoria Accelerated High School.
Ownership History
Date
Name
Owned For
Owner Type
Purchase Details
Closed on
Oct 25, 2012
Sold by
Tri Ranch Properties Llc
Bought by
Windsor Avenue Enterprises Llc
Current Estimated Value
Purchase Details
Closed on
Jul 24, 2008
Sold by
U S Bank Na
Bought by
Tri Ranch Properties Llc
Purchase Details
Closed on
Jun 13, 2008
Sold by
Carrazco Rolando
Bought by
U S Bank Na and J P Morgan Chase Bank Na Jpmac 2006-Rmi
Purchase Details
Closed on
Oct 21, 2004
Sold by
Carrazco Maribel
Bought by
Carrazco Rolando
Purchase Details
Closed on
Apr 5, 2001
Sold by
Palucha Robert and Palucha Diane
Bought by
Carrazco Rolando and Carrasco Maribel
Home Financials for this Owner
Home Financials are based on the most recent Mortgage that was taken out on this home.
Original Mortgage
$94,059
Interest Rate
7.19%
Mortgage Type
FHA
Create a Home Valuation Report for This Property
The Home Valuation Report is an in-depth analysis detailing your home's value as well as a comparison with similar homes in the area
Home Values in the Area
Average Home Value in this Area
Purchase History
| Date | Buyer | Sale Price | Title Company |
|---|---|---|---|
| Windsor Avenue Enterprises Llc | -- | None Available | |
| Tri Ranch Properties Llc | $65,500 | Lawyers Title Insurance Corp | |
| U S Bank Na | $99,400 | Accommodation | |
| Carrazco Rolando | -- | -- | |
| Carrazco Rolando | $94,900 | Stewart Title & Trust |
Source: Public Records
Mortgage History
| Date | Status | Borrower | Loan Amount |
|---|---|---|---|
| Previous Owner | Carrazco Rolando | $94,059 |
Source: Public Records
Tax History Compared to Growth
Tax History
| Year | Tax Paid | Tax Assessment Tax Assessment Total Assessment is a certain percentage of the fair market value that is determined by local assessors to be the total taxable value of land and additions on the property. | Land | Improvement |
|---|---|---|---|---|
| 2025 | $620 | $6,636 | -- | -- |
| 2024 | $608 | $6,320 | -- | -- |
| 2023 | $608 | $21,510 | $4,300 | $17,210 |
| 2022 | $597 | $16,470 | $3,290 | $13,180 |
| 2021 | $625 | $14,620 | $2,920 | $11,700 |
| 2020 | $629 | $13,400 | $2,680 | $10,720 |
| 2019 | $610 | $11,550 | $2,310 | $9,240 |
| 2018 | $591 | $11,230 | $2,240 | $8,990 |
| 2017 | $590 | $9,780 | $1,950 | $7,830 |
| 2016 | $583 | $8,710 | $1,740 | $6,970 |
| 2015 | $542 | $6,650 | $1,330 | $5,320 |
Source: Public Records
Map
Nearby Homes
- 8735 W Christopher Michael Ln
- 8734 W Sahuaro Dr
- 10951 N 91st Ave Unit 120
- 10951 N 91st Ave Unit 266
- 10951 N 91st Ave Unit 84
- 10951 N 91st Ave Unit 177
- 10951 N 91st Ave Unit 158
- 10951 N 91st Ave Unit 60
- 10951 N 91st Ave Unit 263
- 10951 N 91st Ave Unit 218
- 10951 N 91st Ave Unit 184
- 10951 N 91st Ave Unit 216
- 10951 N 91st Ave Unit 16
- 10951 N 91st Ave Unit 32
- 10951 N 91st Ave Unit 245
- 10951 N 91st Ave Unit 23
- 10951 N 91st Ave Unit 6
- 10951 N 91st Ave Unit 254
- 11411 N 91st Ave Unit 235
- 11411 N 91st Ave Unit 75
- 10926 N 88th Dr
- 8839 W Yucca St
- 10920 N 88th Dr
- 8838 W Mescal St
- 8833 W Yucca St
- 10914 N 88th Dr
- 8832 W Mescal St
- 8839 W Jennifer Rose Ct
- 8827 W Yucca St
- 11319 N 88th Dr
- 8837 W Mescal St
- 8826 W Mescal St
- 8845 W Jennifer Rose Ct
- 8834 W Jennifer Rose Ct
- 8840 W Jennifer Rose Ct
- 11323 N 88th Dr
- 8831 W Mescal St
- 8821 W Yucca St
- 10902 N 88th Dr
- 11318 N 88th Ave