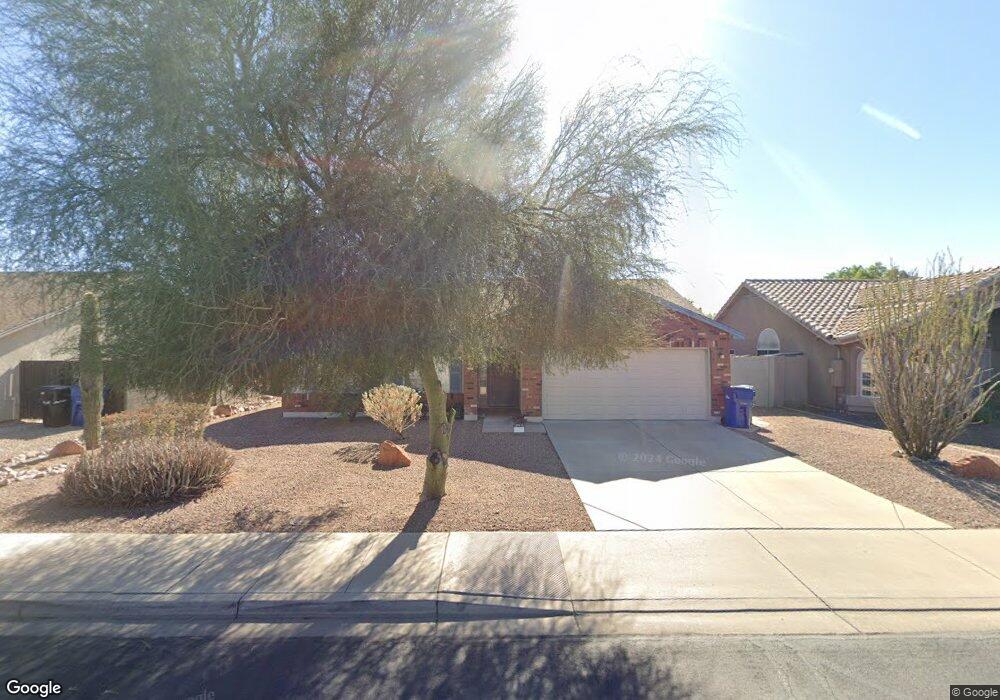
10933 E Cholla Rd Mesa, AZ 85207
Northeast Mesa NeighborhoodEstimated Value: $357,302 - $416,000
3
Beds
2
Baths
1,418
Sq Ft
$278/Sq Ft
Est. Value
About This Home
This home is located at 10933 E Cholla Rd, Mesa, AZ 85207 and is currently estimated at $394,576, approximately $278 per square foot. 10933 E Cholla Rd is a home located in Maricopa County with nearby schools including Sousa Elementary School, Franklin at Brimhall Elementary School, and Franklin West Elementary School.
Ownership History
Date
Name
Owned For
Owner Type
Purchase Details
Closed on
Apr 6, 2001
Sold by
Rufolo Michael J and Imse Danielle A
Bought by
Knoblock Michael W
Current Estimated Value
Home Financials for this Owner
Home Financials are based on the most recent Mortgage that was taken out on this home.
Original Mortgage
$119,130
Outstanding Balance
$43,589
Interest Rate
6.92%
Mortgage Type
FHA
Estimated Equity
$350,987
Purchase Details
Closed on
Dec 8, 1998
Sold by
Providence Homes Inc
Bought by
Rufolo Michael J and Imse Danielle A
Home Financials for this Owner
Home Financials are based on the most recent Mortgage that was taken out on this home.
Original Mortgage
$100,205
Interest Rate
6.91%
Mortgage Type
FHA
Purchase Details
Closed on
Dec 7, 1998
Sold by
Providence Development Inc
Bought by
Providence Homes Inc
Home Financials for this Owner
Home Financials are based on the most recent Mortgage that was taken out on this home.
Original Mortgage
$100,205
Interest Rate
6.91%
Mortgage Type
FHA
Create a Home Valuation Report for This Property
The Home Valuation Report is an in-depth analysis detailing your home's value as well as a comparison with similar homes in the area
Home Values in the Area
Average Home Value in this Area
Purchase History
| Date | Buyer | Sale Price | Title Company |
|---|---|---|---|
| Knoblock Michael W | $121,000 | Capital Title Agency | |
| Rufolo Michael J | $108,600 | Security Title Agency | |
| Providence Homes Inc | $95,025 | Security Title Agency |
Source: Public Records
Mortgage History
| Date | Status | Borrower | Loan Amount |
|---|---|---|---|
| Open | Knoblock Michael W | $119,130 | |
| Previous Owner | Rufolo Michael J | $100,205 |
Source: Public Records
Tax History
| Year | Tax Paid | Tax Assessment Tax Assessment Total Assessment is a certain percentage of the fair market value that is determined by local assessors to be the total taxable value of land and additions on the property. | Land | Improvement |
|---|---|---|---|---|
| 2025 | $1,258 | $14,788 | -- | -- |
| 2024 | $1,271 | $14,083 | -- | -- |
| 2023 | $1,271 | $28,620 | $5,720 | $22,900 |
| 2022 | $1,244 | $21,230 | $4,240 | $16,990 |
| 2021 | $1,273 | $19,580 | $3,910 | $15,670 |
| 2020 | $1,257 | $18,630 | $3,720 | $14,910 |
| 2019 | $1,307 | $17,020 | $3,400 | $13,620 |
| 2018 | $1,294 | $15,410 | $3,080 | $12,330 |
| 2017 | $1,232 | $13,570 | $2,710 | $10,860 |
| 2016 | $1,106 | $12,880 | $2,570 | $10,310 |
| 2015 | $1,146 | $11,730 | $2,340 | $9,390 |
Source: Public Records
Map
Nearby Homes
- 538 N 110th St
- 11029 E Decatur St
- 433 N 111th Place
- 813 N 110th St
- 345 N Signal Butte Rd Unit 23
- 11101 E University Dr Unit 108
- 11101 E University Dr Unit 214
- 11508 E Cholla Rd
- 315 N Keith St
- 820 N 111th St
- 833 N 110th St
- 456 N Opal
- 10620 E Caballero St
- 11248 E Dartmouth Cir
- 11201 E Jupiter Dr
- 11308 E Contessa St
- 10813 E Boston St
- 10745 E Evergreen St
- 11340 E Caballero St
- 11345 E Camino St
- 10941 E Cholla Rd
- 10927 E Cholla Rd
- 10932 E Covina St
- 10938 E Covina St
- 10919 E Cholla Rd
- 10947 E Cholla Rd
- 10926 E Covina St
- 10932 E Cholla Rd
- 10940 E Cholla Rd
- 10944 E Covina St
- 10913 E Cholla Rd
- 10920 E Covina St
- 10955 E Cholla Rd
- 10948 E Cholla Rd
- 533 N St Claire
- 10956 E Cholla Rd
- 10931 E Covina St
- 10925 E Covina St
- 546 N 110th St
- 563 N Garrison
Your Personal Tour Guide
Ask me questions while you tour the home.