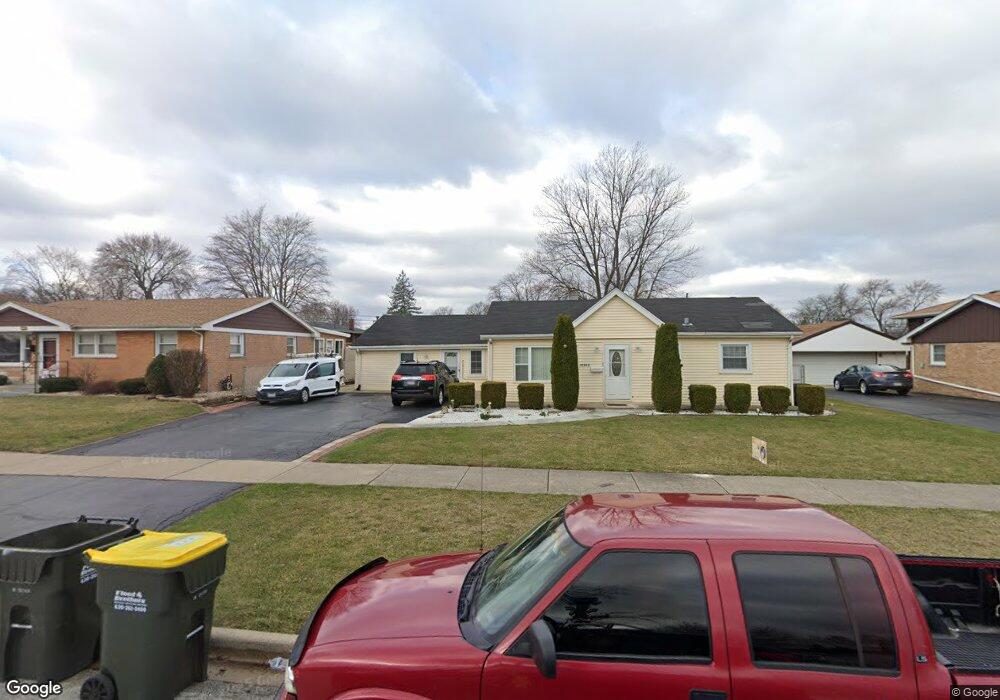
10936 Massasoit Ave Chicago Ridge, IL 60415
Estimated Value: $201,000 - $261,579
3
Beds
1
Bath
864
Sq Ft
$268/Sq Ft
Est. Value
About This Home
This home is located at 10936 Massasoit Ave, Chicago Ridge, IL 60415 and is currently estimated at $231,895, approximately $268 per square foot. 10936 Massasoit Ave is a home located in Cook County with nearby schools including Ridge Central Elementary School, Elden D Finley Jr High School, and Harold L. Richards High School.
Ownership History
Date
Name
Owned For
Owner Type
Purchase Details
Closed on
Jan 27, 2022
Sold by
Zavala Juan and Zavala Peggy
Bought by
Zavala Refugio and Zavala Silvia
Current Estimated Value
Purchase Details
Closed on
Jan 14, 2022
Sold by
Zavala Juan and Zavala Peggy
Bought by
Zavala Refugio and Zavala Silvia
Purchase Details
Closed on
Oct 6, 2008
Sold by
Zavala Juan
Bought by
Zavala Juan and Zavala Peggy
Purchase Details
Closed on
Sep 16, 2008
Sold by
World Savings Bank
Bought by
Zavala Juan
Purchase Details
Closed on
Jul 23, 2008
Sold by
Lowery Gerald A
Bought by
World Savings Bank Fsb
Purchase Details
Closed on
Nov 5, 1999
Sold by
Lowery Gerald A
Bought by
Lowery Gerald A and Lowery Patricia
Home Financials for this Owner
Home Financials are based on the most recent Mortgage that was taken out on this home.
Original Mortgage
$97,500
Interest Rate
12.5%
Create a Home Valuation Report for This Property
The Home Valuation Report is an in-depth analysis detailing your home's value as well as a comparison with similar homes in the area
Home Values in the Area
Average Home Value in this Area
Purchase History
| Date | Buyer | Sale Price | Title Company |
|---|---|---|---|
| Zavala Refugio | -- | -- | |
| Zavala Refugio | -- | -- | |
| Zavala Refugio | -- | -- | |
| Zavala Juan | -- | None Available | |
| Zavala Juan | $115,000 | Premier Title | |
| World Savings Bank Fsb | -- | None Available | |
| Lowery Gerald A | -- | -- |
Source: Public Records
Mortgage History
| Date | Status | Borrower | Loan Amount |
|---|---|---|---|
| Previous Owner | Lowery Gerald A | $97,500 |
Source: Public Records
Tax History Compared to Growth
Tax History
| Year | Tax Paid | Tax Assessment Tax Assessment Total Assessment is a certain percentage of the fair market value that is determined by local assessors to be the total taxable value of land and additions on the property. | Land | Improvement |
|---|---|---|---|---|
| 2024 | $5,087 | $19,000 | $6,512 | $12,488 |
| 2023 | $4,141 | $19,000 | $6,512 | $12,488 |
| 2022 | $4,141 | $13,990 | $5,698 | $8,292 |
| 2021 | $3,996 | $13,989 | $5,698 | $8,291 |
| 2020 | $4,031 | $13,989 | $5,698 | $8,291 |
| 2019 | $3,827 | $13,231 | $5,155 | $8,076 |
| 2018 | $3,637 | $13,231 | $5,155 | $8,076 |
| 2017 | $3,666 | $13,231 | $5,155 | $8,076 |
| 2016 | $3,300 | $10,770 | $4,341 | $6,429 |
| 2015 | $3,188 | $10,770 | $4,341 | $6,429 |
| 2014 | $2,440 | $10,770 | $4,341 | $6,429 |
| 2013 | $3,623 | $13,024 | $4,341 | $8,683 |
Source: Public Records
Map
Nearby Homes
- 5730 110th St
- 11013 Menard Ave
- 10832 Massasoit Ave
- 5825 109th St
- 10930 Central Ave Unit 1B
- 11000 Central Ave Unit 2C
- 11010 Central Ave Unit 3A
- 5924 W 109th St
- 11024 Mason Ave
- 10755 Mason Ave
- 10925 Mcvicker Ave
- 10710 Central Ave Unit 3D
- 5810 107th Court Way
- 10925 Lyman Ave
- 10624 S Central Ave Unit 1
- 6040 111th St
- 10620 S Central Ave Unit 1A
- 10620 S Central Ave Unit 3A
- 10616 Central Ave Unit 1N
- 10854 Lyman Ave
- 10942 Massasoit Ave
- 10934 Massasoit Ave
- 10943 Menard Ave
- 10948 Massasoit Ave
- 10947 Menard Ave
- 10939 Menard Ave
- 10955 Menard Ave
- 10933 Menard Ave
- 10939 Massasoit Ave
- 10956 Massasoit Ave
- 10912 Massasoit Ave
- 10931 Massasoit Ave
- 10947 Massasoit Ave
- 10957 Menard Ave
- 10919 Massasoit Ave
- 10955 Massasoit Ave
- 10908 Massasoit Ave
- 10913 Massasoit Ave
- 10909 Menard Ave
- 10930 Menard Ave