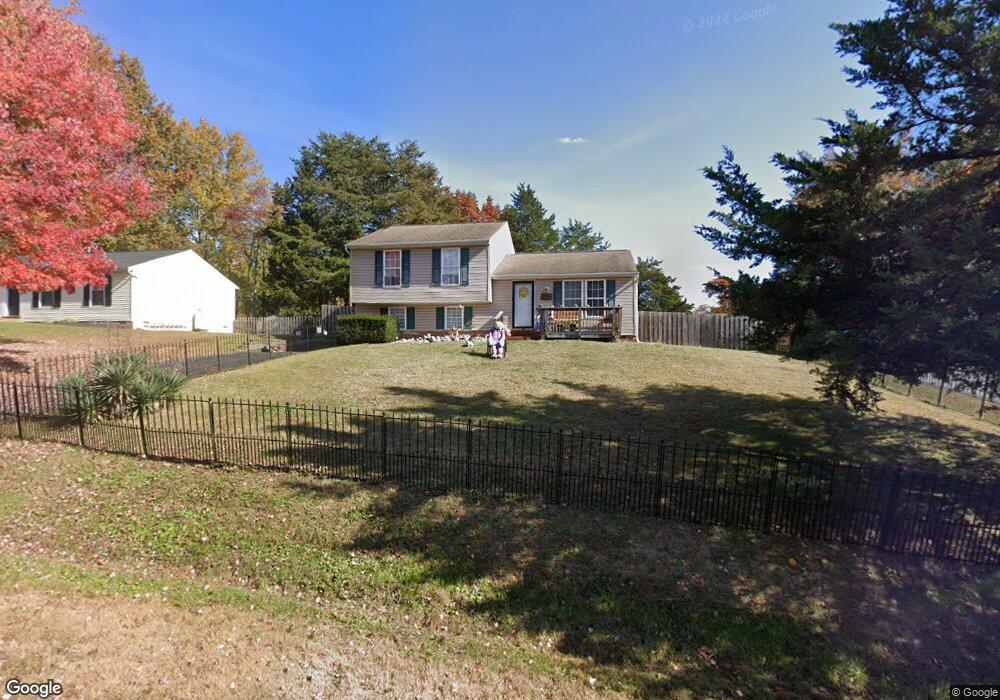
10937 Huntington Woods Cir Fredericksburg, VA 22407
Chancellor NeighborhoodEstimated Value: $345,280 - $376,000
3
Beds
2
Baths
1,040
Sq Ft
$346/Sq Ft
Est. Value
About This Home
This home is located at 10937 Huntington Woods Cir, Fredericksburg, VA 22407 and is currently estimated at $360,320, approximately $346 per square foot. 10937 Huntington Woods Cir is a home located in Spotsylvania County with nearby schools including Battlefield Elementary School, Chancellor Middle School, and Chancellor High School.
Ownership History
Date
Name
Owned For
Owner Type
Purchase Details
Closed on
Feb 27, 2009
Sold by
Burrell Robert
Bought by
Mcbeath Arthur
Current Estimated Value
Home Financials for this Owner
Home Financials are based on the most recent Mortgage that was taken out on this home.
Original Mortgage
$194,085
Outstanding Balance
$122,559
Interest Rate
5%
Mortgage Type
VA
Estimated Equity
$237,761
Purchase Details
Closed on
Jul 31, 2008
Sold by
Us Bank Na
Bought by
Burrell Robert
Purchase Details
Closed on
Feb 4, 2008
Sold by
Samuel I White Pc
Bought by
Us Bank Na
Purchase Details
Closed on
Jan 31, 2006
Sold by
Morefield John L
Bought by
Vasquez Victor M
Home Financials for this Owner
Home Financials are based on the most recent Mortgage that was taken out on this home.
Original Mortgage
$208,000
Interest Rate
6.31%
Mortgage Type
New Conventional
Create a Home Valuation Report for This Property
The Home Valuation Report is an in-depth analysis detailing your home's value as well as a comparison with similar homes in the area
Home Values in the Area
Average Home Value in this Area
Purchase History
| Date | Buyer | Sale Price | Title Company |
|---|---|---|---|
| Mcbeath Arthur | $190,000 | -- | |
| Burrell Robert | $115,000 | -- | |
| Us Bank Na | $144,000 | -- | |
| Vasquez Victor M | $260,000 | -- |
Source: Public Records
Mortgage History
| Date | Status | Borrower | Loan Amount |
|---|---|---|---|
| Open | Mcbeath Arthur | $194,085 | |
| Previous Owner | Vasquez Victor M | $208,000 |
Source: Public Records
Tax History Compared to Growth
Tax History
| Year | Tax Paid | Tax Assessment Tax Assessment Total Assessment is a certain percentage of the fair market value that is determined by local assessors to be the total taxable value of land and additions on the property. | Land | Improvement |
|---|---|---|---|---|
| 2025 | $1,942 | $264,500 | $125,000 | $139,500 |
| 2024 | $1,942 | $264,500 | $125,000 | $139,500 |
| 2023 | $1,668 | $216,200 | $95,000 | $121,200 |
| 2022 | $1,595 | $216,200 | $95,000 | $121,200 |
| 2021 | $1,623 | $200,500 | $80,000 | $120,500 |
| 2020 | $1,623 | $200,500 | $80,000 | $120,500 |
| 2019 | $1,644 | $194,000 | $80,000 | $114,000 |
| 2018 | $1,616 | $194,000 | $80,000 | $114,000 |
| 2017 | $5 | $169,400 | $60,000 | $109,400 |
| 2016 | $14 | $168,300 | $60,000 | $108,300 |
| 2015 | $753 | $157,300 | $42,500 | $114,800 |
| 2014 | $753 | $157,300 | $42,500 | $114,800 |
Source: Public Records
Map
Nearby Homes
- 10911 Antelope Trail
- 6700 Reindeer Ct
- 11100 Saturn Ct
- 10611 Cobblestone Dr
- 10611 Maple Ridge Dr
- 7002 Zenith Ct
- 6505 Royal Oaks Dr
- 6501 Royal Oaks Dr
- 6930 Versaille Dr
- 6905 Xandu Ct
- 6030 Hot Spring Ln
- 11100 Ascot Cir
- 11114 Ascot Cir
- 6310 Wendover Ct
- 11139 Gander Ct
- 10028 Gander Ct
- 10041 Gander Ct
- 10008 Gander Ct
- 11002 Jaguar Ct
- 11004 Jaguar Ct
- 10939 Huntington Woods Cir
- 10935 Huntington Woods Cir
- 11936 Long Leaf Ct
- 11938 Long Leaf Ct
- 11934 Long Leaf Ct
- 10936 Huntington Woods Cir
- 10941 Huntington Woods Cir
- 10934 Huntington Woods Cir
- 10933 Huntington Woods Cir
- 10940 Huntington Woods Cir
- 11932 Long Leaf Ct
- 10942 Huntington Woods Cir
- 10932 Huntington Woods Cir
- 11001 Huntington Woods Cir
- 11940 Long Leaf Ct
- 10944 Huntington Woods Cir
- 11937 Long Leaf Ct
- 11935 Long Leaf Ct
- 11003 Huntington Woods Cir
- 11933 Long Leaf Ct