Estimated Value: $233,000 - $273,000
3
Beds
1
Bath
876
Sq Ft
$282/Sq Ft
Est. Value
About This Home
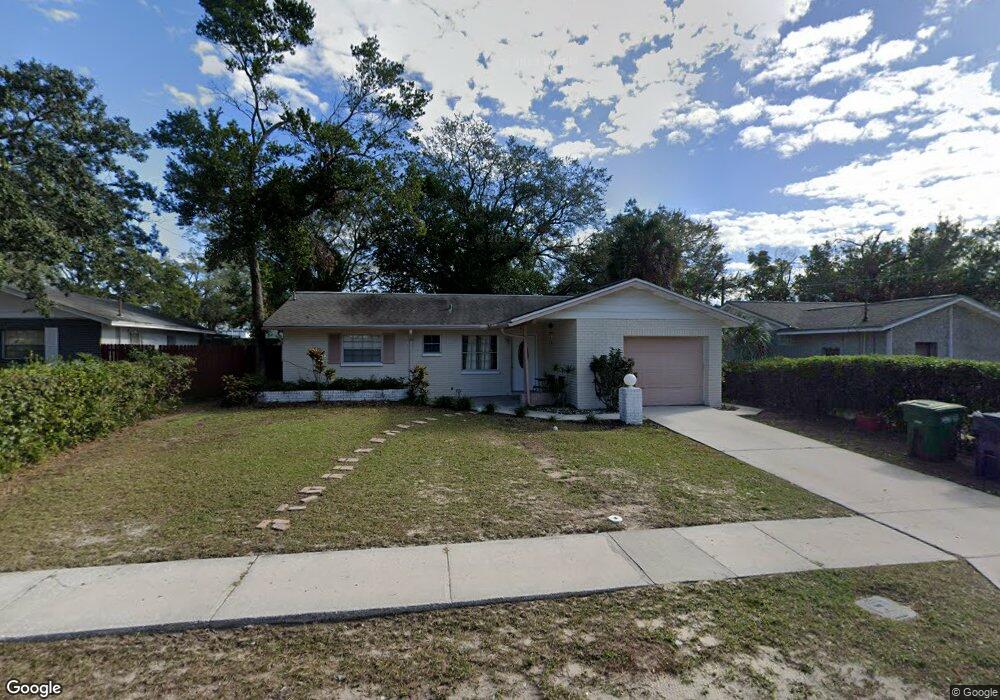
This home is located at 10937 N 29th St, Tampa, FL 33612 and is currently estimated at $247,189, approximately $282 per square foot. 10937 N 29th St is a home located in Hillsborough County with nearby schools including Witter Elementary School, Adams Middle School, and Wharton High School.
Ownership History
Date
Name
Owned For
Owner Type
Purchase Details
Closed on
Dec 1, 2015
Sold by
Eastley Penny A and Jordan Carla
Bought by
Falcon Investment Corporation Of Tampa
Current Estimated Value
Purchase Details
Closed on
Oct 10, 2006
Sold by
Jordan Carla
Bought by
Eastley Penny A and Jordan Carla
Home Financials for this Owner
Home Financials are based on the most recent Mortgage that was taken out on this home.
Original Mortgage
$116,000
Interest Rate
10.15%
Mortgage Type
Unknown
Purchase Details
Closed on
Oct 18, 2001
Sold by
Eastley Penny A
Bought by
Jordan Carla
Home Financials for this Owner
Home Financials are based on the most recent Mortgage that was taken out on this home.
Original Mortgage
$3,750
Interest Rate
6.85%
Mortgage Type
New Conventional
Purchase Details
Closed on
Nov 13, 1995
Sold by
Douglass John D and Douglass Thelma
Bought by
Eastley Penny A
Create a Home Valuation Report for This Property
The Home Valuation Report is an in-depth analysis detailing your home's value as well as a comparison with similar homes in the area
Home Values in the Area
Average Home Value in this Area
Purchase History
| Date | Buyer | Sale Price | Title Company |
|---|---|---|---|
| Falcon Investment Corporation Of Tampa | $65,100 | None Available | |
| Eastley Penny A | $58,000 | Alliance Title Company | |
| Jordan Carla | $75,000 | -- | |
| Eastley Penny A | $55,000 | -- |
Source: Public Records
Mortgage History
| Date | Status | Borrower | Loan Amount |
|---|---|---|---|
| Previous Owner | Eastley Penny A | $116,000 | |
| Previous Owner | Eastley Penny A | $3,750 | |
| Previous Owner | Eastley Penny A | $63,750 | |
| Previous Owner | Eastley Penny A | $17,721 |
Source: Public Records
Tax History Compared to Growth
Tax History
| Year | Tax Paid | Tax Assessment Tax Assessment Total Assessment is a certain percentage of the fair market value that is determined by local assessors to be the total taxable value of land and additions on the property. | Land | Improvement |
|---|---|---|---|---|
| 2024 | $2,435 | $151,022 | $52,520 | $98,502 |
| 2023 | $2,245 | $137,389 | $49,238 | $88,151 |
| 2022 | $2,138 | $137,422 | $42,672 | $94,750 |
| 2021 | $1,846 | $97,304 | $31,184 | $66,120 |
| 2020 | $1,688 | $86,669 | $29,542 | $57,127 |
| 2019 | $1,572 | $82,072 | $26,260 | $55,812 |
| 2018 | $1,459 | $75,148 | $0 | $0 |
| 2017 | $1,349 | $63,953 | $0 | $0 |
| 2016 | $1,181 | $51,614 | $0 | $0 |
| 2015 | $1,041 | $45,900 | $0 | $0 |
| 2014 | $912 | $41,680 | $0 | $0 |
| 2013 | -- | $37,934 | $0 | $0 |
Source: Public Records
Map
Nearby Homes
- 2620 E Liberty St
- 2603 E 110th Ave
- 2329 E 110th Ave
- 2322 E 111th Ave
- 10220 N 23rd St
- 10208 Lola St
- 1905 Meridel Ave
- 10015 N 25th St
- 1912 Brust Ave
- 11411 N 19th St
- 10007 N 26th St
- 2104 E Navajo Ave
- 2110 E Poinsettia Ave
- 10009 N 22nd St
- 1806 Marvy Ave
- 1807 E Bougainvillea Ave
- 2108 E Linebaugh Ave
- 1806 E Poinsettia Ave
- 1511 Meridel Ave
- 1801 E Poinsettia Ave
- 10935 N 29th St
- 10939 N 29th St
- 10933 N 29th St
- 11210 N 30th St
- 10936 N 29th St
- 10938 N 29th St
- 10934 N 29th St
- 10931 N 29th St
- 11154 N 30th St
- 10932 N 29th St
- 11111 N 28th St
- 11113 N 28th St
- 10929 N 29th St
- 11109 N 28th St
- 11142 N 30th St
- 10930 N 29th St
- 11107 N 28th St
- 10927 N 29th St
- 10928 N 29th St
- 11105 N 28th St