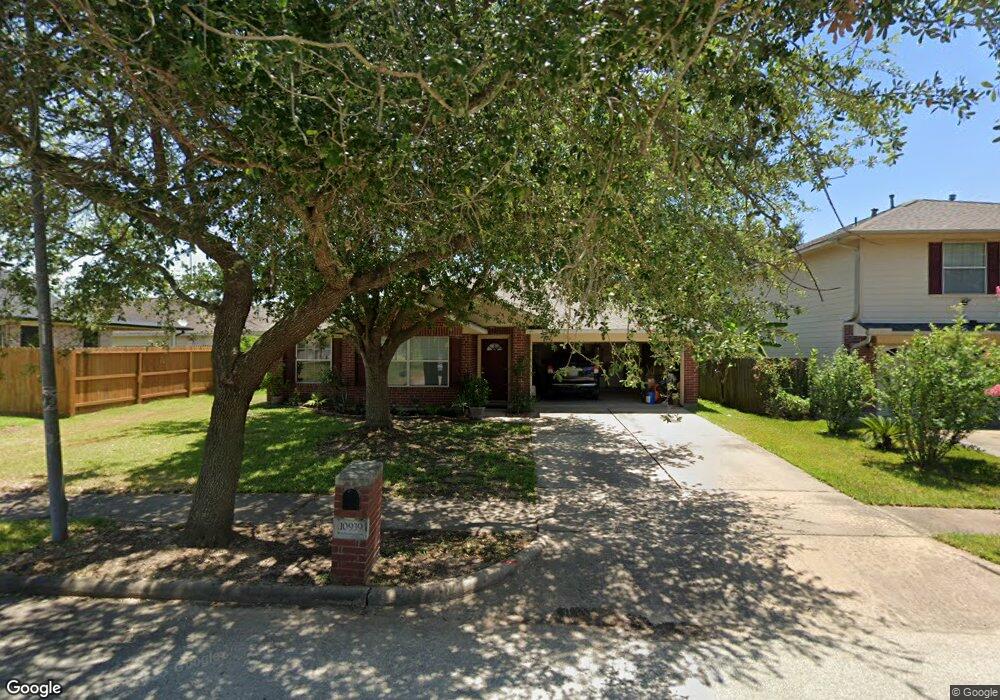
10939 Kess Way Ln Houston, TX 77075
Southbelt-Ellington NeighborhoodEstimated Value: $304,546 - $330,000
3
Beds
3
Baths
2,652
Sq Ft
$121/Sq Ft
Est. Value
About This Home
This home is located at 10939 Kess Way Ln, Houston, TX 77075 and is currently estimated at $321,137, approximately $121 per square foot. 10939 Kess Way Ln is a home located in Harris County with nearby schools including Laura Welch Bush Elementary School, Morris Middle School, and Beverly Hill Intermediate School.
Ownership History
Date
Name
Owned For
Owner Type
Purchase Details
Closed on
Apr 27, 2017
Sold by
Tran Thanh and Thay Phung
Bought by
Jack Robert Lee
Current Estimated Value
Home Financials for this Owner
Home Financials are based on the most recent Mortgage that was taken out on this home.
Original Mortgage
$186,558
Outstanding Balance
$154,157
Interest Rate
3.87%
Mortgage Type
FHA
Estimated Equity
$166,980
Purchase Details
Closed on
Jul 1, 2004
Sold by
Chatwood Place Lp
Bought by
Tran Thanh
Home Financials for this Owner
Home Financials are based on the most recent Mortgage that was taken out on this home.
Original Mortgage
$88,480
Interest Rate
6.31%
Mortgage Type
Purchase Money Mortgage
Purchase Details
Closed on
May 6, 2004
Sold by
Parkstone Building Co Lp
Bought by
Chatwood Place Lp
Home Financials for this Owner
Home Financials are based on the most recent Mortgage that was taken out on this home.
Original Mortgage
$88,480
Interest Rate
6.31%
Mortgage Type
Purchase Money Mortgage
Create a Home Valuation Report for This Property
The Home Valuation Report is an in-depth analysis detailing your home's value as well as a comparison with similar homes in the area
Home Values in the Area
Average Home Value in this Area
Purchase History
| Date | Buyer | Sale Price | Title Company |
|---|---|---|---|
| Jack Robert Lee | -- | None Available | |
| Tran Thanh | -- | Commonwealth Title | |
| Chatwood Place Lp | -- | -- |
Source: Public Records
Mortgage History
| Date | Status | Borrower | Loan Amount |
|---|---|---|---|
| Open | Jack Robert Lee | $186,558 | |
| Previous Owner | Tran Thanh | $88,480 |
Source: Public Records
Tax History Compared to Growth
Tax History
| Year | Tax Paid | Tax Assessment Tax Assessment Total Assessment is a certain percentage of the fair market value that is determined by local assessors to be the total taxable value of land and additions on the property. | Land | Improvement |
|---|---|---|---|---|
| 2025 | $5,462 | $330,040 | $53,737 | $276,303 |
| 2024 | $5,462 | $320,184 | $53,737 | $266,447 |
| 2023 | $5,462 | $349,849 | $53,737 | $296,112 |
| 2022 | $6,574 | $292,865 | $41,240 | $251,625 |
| 2021 | $6,271 | $233,443 | $41,240 | $192,203 |
| 2020 | $6,168 | $225,012 | $37,491 | $187,521 |
| 2019 | $6,226 | $220,594 | $34,367 | $186,227 |
| 2018 | $2,265 | $196,321 | $26,556 | $169,765 |
| 2017 | $5,407 | $196,321 | $26,556 | $169,765 |
| 2016 | $4,847 | $182,700 | $24,057 | $158,643 |
| 2015 | $3,485 | $160,000 | $21,870 | $138,130 |
| 2014 | $3,485 | $157,647 | $21,870 | $135,777 |
Source: Public Records
Map
Nearby Homes
- 10847 Nellsfield Ln
- 9130 Garden Breeze Dr
- 10858 Shannon Mills Ln
- 8718 Black Cliff Ln
- 8626 Valley Crest Ln
- 8615 Tartan Walk Ln
- 11115 Opal Glen Ln
- 10934 Bradford Way Dr
- 9307 Fuqua Ridge Ln
- 10806 Tallow Briar
- 10918 Linden Gate Dr
- 10827 Linden Gate Dr
- 001 Fuqua St
- 0 Fuqua St Unit 64883593
- 0 Fuqua St Unit 45902141
- 0 Fuqua St Unit 97219329
- 10506 Pleasant Villas Ln
- 8612 Fuqua St
- 7329 Madison Commons Ln
- 7322 Madison Commons Ln
- 10943 Kess Way Ln
- 9002 Mercury Cove Ct
- 9006 Mercury Cove Ct
- 10947 Kess Way Ln
- 9010 Mercury Cove Ct
- 9103 Dove Way
- 10902 Ivy Park
- 10938 Kess Way Ln
- 9014 Mercury Cove Ct
- 10942 Kess Way Ln
- 10951 Kess Way Ln
- 10906 Ivy Park
- 9018 Mercury Cove Ct
- 10946 Kess Way Ln
- 9107 Dove Way
- 9022 Mercury Cove Ct
- 10910 Ivy Park
- 9011 Mercury Cove Ct
- 9111 Dove Way
- 9007 Mercury Cove Ct