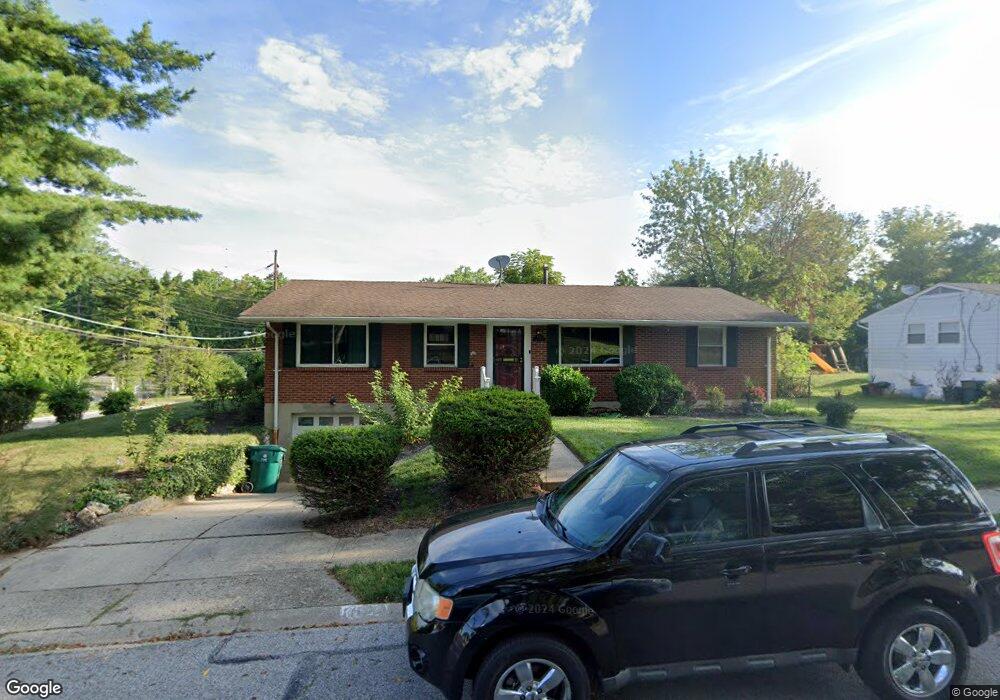
1094 Albany Terrace Cincinnati, OH 45224
College Hill NeighborhoodEstimated Value: $196,000 - $224,000
2
Beds
2
Baths
1,404
Sq Ft
$150/Sq Ft
Est. Value
About This Home
This home is located at 1094 Albany Terrace, Cincinnati, OH 45224 and is currently estimated at $210,826, approximately $150 per square foot. 1094 Albany Terrace is a home located in Hamilton County with nearby schools including Pleasant Hill Elementary School, Robert A. Taft Information Technology High School, and Western Hills High School.
Ownership History
Date
Name
Owned For
Owner Type
Purchase Details
Closed on
Mar 18, 2013
Sold by
Taul Janet M and Taylor Janet M
Bought by
Taylor Janet M
Current Estimated Value
Home Financials for this Owner
Home Financials are based on the most recent Mortgage that was taken out on this home.
Original Mortgage
$148,719
Outstanding Balance
$105,940
Interest Rate
3.75%
Mortgage Type
FHA
Estimated Equity
$104,886
Purchase Details
Closed on
Mar 11, 2010
Sold by
Taul Robert E
Bought by
Taul Janet M
Purchase Details
Closed on
Dec 21, 2008
Sold by
Taul Robert E and Taul Janet M
Bought by
Taul Robert E and Taul Janet M
Purchase Details
Closed on
Aug 16, 2002
Sold by
Saunders Amy L
Bought by
Taul Robert E and Taul Janet M
Home Financials for this Owner
Home Financials are based on the most recent Mortgage that was taken out on this home.
Original Mortgage
$124,900
Interest Rate
6.63%
Purchase Details
Closed on
Apr 30, 1998
Sold by
Grider Carrie A
Bought by
Saunders Amy L
Create a Home Valuation Report for This Property
The Home Valuation Report is an in-depth analysis detailing your home's value as well as a comparison with similar homes in the area
Home Values in the Area
Average Home Value in this Area
Purchase History
| Date | Buyer | Sale Price | Title Company |
|---|---|---|---|
| Taylor Janet M | -- | Attorney | |
| Taul Janet M | -- | None Available | |
| Taul Robert E | -- | Attorney | |
| Taul Robert E | $131,500 | -- | |
| Saunders Amy L | $71,000 | -- |
Source: Public Records
Mortgage History
| Date | Status | Borrower | Loan Amount |
|---|---|---|---|
| Open | Taylor Janet M | $148,719 | |
| Closed | Taul Robert E | $124,900 |
Source: Public Records
Tax History Compared to Growth
Tax History
| Year | Tax Paid | Tax Assessment Tax Assessment Total Assessment is a certain percentage of the fair market value that is determined by local assessors to be the total taxable value of land and additions on the property. | Land | Improvement |
|---|---|---|---|---|
| 2024 | $2,969 | $48,955 | $9,786 | $39,169 |
| 2023 | $3,035 | $48,955 | $9,786 | $39,169 |
| 2022 | $2,206 | $31,700 | $7,970 | $23,730 |
| 2021 | $2,109 | $31,700 | $7,970 | $23,730 |
| 2020 | $2,162 | $31,700 | $7,970 | $23,730 |
| 2019 | $2,055 | $27,805 | $6,990 | $20,815 |
| 2018 | $2,058 | $27,805 | $6,990 | $20,815 |
| 2017 | $1,955 | $27,805 | $6,990 | $20,815 |
| 2016 | $2,155 | $30,230 | $7,455 | $22,775 |
| 2015 | $1,943 | $30,230 | $7,455 | $22,775 |
| 2014 | $1,957 | $30,230 | $7,455 | $22,775 |
| 2013 | $2,052 | $31,164 | $7,686 | $23,478 |
Source: Public Records
Map
Nearby Homes
- 5839 Argus Rd
- 1127 Cedar Ave
- 1054 Grayview Ct
- 6014 Argus Rd
- 1090 Elda Ln
- 1147 Homeside Ave
- 1137 Homeside Ave
- 6000 Capri Dr
- 5687 Folchi Dr
- 6029 Waldway Ln
- 5679 Folchi Dr
- 5974 Sunridge Dr
- 5643 Red Cedar Dr
- 6123 Faircrest Ct
- 5773 Lantana Ave
- 5923 Lantana Ave
- 1417 Cedar Ave
- 6090 Scarlet Dr
- 1428 Ambrose Ave
- 1437 Ambrose Ave
- 1084 Albany Terrace
- 5850 Argus Rd
- 1095 Albany Terrace
- 1085 Albany Terrace
- 5828 Argus Rd
- 1081 Albany Terrace
- 5824 Argus Rd
- 1076 Albany Terrace
- 5835 Argus Rd
- 1077 Albany Terrace
- 5820 Argus Rd
- 5831 Argus Rd
- 1072 Albany Terrace
- 5900 Argus Rd
- 5816 Argus Rd
- 1073 Albany Terrace
- 5823 Argus Rd
- 5896 Argus Rd
- 1121 Cedar Ave
- 1068 Albany Terrace