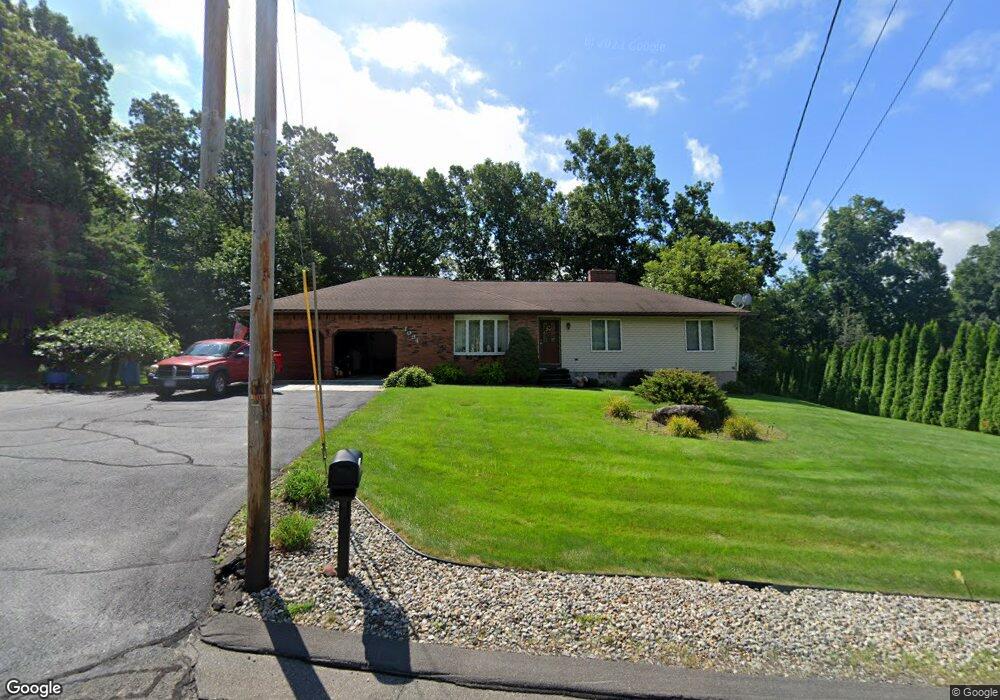
1094 East St Ludlow, MA 01056
Estimated Value: $467,092 - $568,000
3
Beds
3
Baths
1,655
Sq Ft
$305/Sq Ft
Est. Value
About This Home
This home is located at 1094 East St, Ludlow, MA 01056 and is currently estimated at $504,023, approximately $304 per square foot. 1094 East St is a home located in Hampden County with nearby schools including East Street Elementary School, Chapin Street Elementary School, and Paul R. Baird Middle School.
Ownership History
Date
Name
Owned For
Owner Type
Purchase Details
Closed on
Jan 25, 2017
Sold by
Nogueira Jose F and Nogueira Maria J
Bought by
Morais Michelle N and Nogueira Brian S
Current Estimated Value
Purchase Details
Closed on
Sep 18, 2015
Sold by
Nogueira Jose F and Nogueira Maria J
Bought by
Morais Michelle N and Nogueira Brian S
Purchase Details
Closed on
Jul 12, 1985
Bought by
Nogueira Jose F and Nogueira Maria J
Create a Home Valuation Report for This Property
The Home Valuation Report is an in-depth analysis detailing your home's value as well as a comparison with similar homes in the area
Home Values in the Area
Average Home Value in this Area
Purchase History
| Date | Buyer | Sale Price | Title Company |
|---|---|---|---|
| Morais Michelle N | -- | -- | |
| Morais Michelle N | -- | -- | |
| Morais Michelle N | -- | -- | |
| Nogueira Jose F | -- | -- |
Source: Public Records
Mortgage History
| Date | Status | Borrower | Loan Amount |
|---|---|---|---|
| Previous Owner | Nogueira Jose F | $55,000 | |
| Previous Owner | Nogueira Jose F | $45,000 | |
| Previous Owner | Nogueira Jose F | $50,000 |
Source: Public Records
Tax History Compared to Growth
Tax History
| Year | Tax Paid | Tax Assessment Tax Assessment Total Assessment is a certain percentage of the fair market value that is determined by local assessors to be the total taxable value of land and additions on the property. | Land | Improvement |
|---|---|---|---|---|
| 2025 | $7,185 | $414,100 | $81,100 | $333,000 |
| 2024 | $6,829 | $377,500 | $81,100 | $296,400 |
| 2023 | $6,485 | $332,400 | $67,400 | $265,000 |
| 2022 | $6,147 | $307,500 | $67,400 | $240,100 |
| 2021 | $6,098 | $289,300 | $67,400 | $221,900 |
| 2020 | $5,895 | $285,900 | $66,400 | $219,500 |
| 2019 | $5,508 | $277,900 | $65,800 | $212,100 |
| 2018 | $5,184 | $272,700 | $65,800 | $206,900 |
| 2017 | $5,092 | $274,800 | $67,000 | $207,800 |
| 2016 | $5,095 | $281,000 | $77,200 | $203,800 |
| 2015 | $4,774 | $276,100 | $76,400 | $199,700 |
Source: Public Records
Map
Nearby Homes
- 229 Miller St Unit F-13
- 229 Miller St Unit C-1
- 229 Miller St Unit B2
- 308 Miller St Unit 72
- 308 Miller St Unit 79
- 308 Miller St Unit 78
- Lot 28 Tower Rd
- 143 James St
- 1172 East St
- 235 James St
- 22 Balsam Hill Rd
- 88-90 Miller St
- 319 Ventura St
- 425 Miller St
- 51 Newcrest St
- 138 Ridgeview Cir
- 38 King Dr
- 225 Maynard Rd
- 142 Amherst St
- 4 Hillcrest Dr