Estimated Value: $991,000 - $1,323,039
4
Beds
3
Baths
3,941
Sq Ft
$295/Sq Ft
Est. Value
About This Home
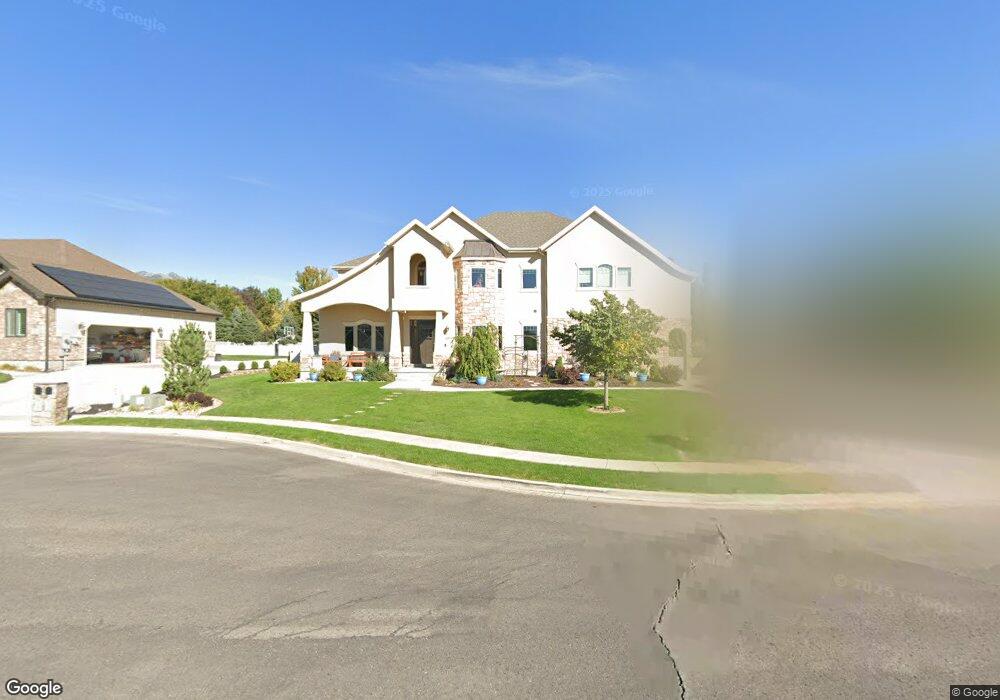
This home is located at 1094 N 1710 E Unit 29, Lehi, UT 84043 and is currently estimated at $1,164,260, approximately $295 per square foot. 1094 N 1710 E Unit 29 is a home located in Utah County with nearby schools including Freedom Elementary School, Lehi Junior High School, and Skyridge High School.
Ownership History
Date
Name
Owned For
Owner Type
Purchase Details
Closed on
Jul 30, 2025
Sold by
Peck Judson Ron and Peck Jackie Lyn
Bought by
Peck Family Revocable Living Trust and Peck
Current Estimated Value
Purchase Details
Closed on
Nov 21, 2013
Sold by
Peck Judson
Bought by
Peck Judson Ron and Peck Jackie Lyn
Home Financials for this Owner
Home Financials are based on the most recent Mortgage that was taken out on this home.
Original Mortgage
$198,000
Interest Rate
4.18%
Mortgage Type
New Conventional
Purchase Details
Closed on
Oct 15, 2013
Sold by
Peck Ron L and Peck Debra Hadfield
Bought by
Peck Judson Ron and Peck Jackie Lyn
Home Financials for this Owner
Home Financials are based on the most recent Mortgage that was taken out on this home.
Original Mortgage
$198,000
Interest Rate
4.18%
Mortgage Type
New Conventional
Purchase Details
Closed on
Nov 26, 2012
Sold by
Peck Ron L and Peck Debbie H
Bought by
Debra Ron L and Debra Hadfield Peck Childre
Create a Home Valuation Report for This Property
The Home Valuation Report is an in-depth analysis detailing your home's value as well as a comparison with similar homes in the area
Home Values in the Area
Average Home Value in this Area
Purchase History
| Date | Buyer | Sale Price | Title Company |
|---|---|---|---|
| Peck Family Revocable Living Trust | -- | None Listed On Document | |
| Peck Judson Ron | -- | Affiliated First Title Co | |
| Peck Judson | -- | Affiliated First Title Co | |
| Peck Judson Ron | -- | Affiliated First Title Co | |
| Debra Ron L | -- | None Available |
Source: Public Records
Mortgage History
| Date | Status | Borrower | Loan Amount |
|---|---|---|---|
| Previous Owner | Peck Judson | $198,000 |
Source: Public Records
Tax History Compared to Growth
Tax History
| Year | Tax Paid | Tax Assessment Tax Assessment Total Assessment is a certain percentage of the fair market value that is determined by local assessors to be the total taxable value of land and additions on the property. | Land | Improvement |
|---|---|---|---|---|
| 2025 | $5,125 | $626,835 | $392,900 | $746,800 |
| 2024 | $5,125 | $599,720 | $0 | $0 |
| 2023 | $4,985 | $633,380 | $0 | $0 |
| 2022 | $4,866 | $599,390 | $0 | $0 |
| 2021 | $4,398 | $819,100 | $227,400 | $591,700 |
| 2020 | $4,148 | $763,600 | $210,600 | $553,000 |
| 2019 | $3,714 | $710,800 | $210,600 | $500,200 |
| 2018 | $3,681 | $666,000 | $199,100 | $466,900 |
| 2017 | $3,529 | $339,405 | $0 | $0 |
| 2016 | $3,307 | $295,075 | $0 | $0 |
| 2015 | $3,622 | $306,790 | $0 | $0 |
| 2014 | $3,625 | $305,250 | $0 | $0 |
Source: Public Records
Map
Nearby Homes
- 9435 N Aspen Hollow Cir
- 893 N 1580 E
- 3935 W 1000 N Unit 438
- 3983 W 1000 N Unit 442
- 4007 W 1000 N
- 3947 W 1000 N Unit 439
- 3959 W 1000 N
- 901 N Lakota Rd
- 1175 E 900 N
- 822 N 860 W Unit 317
- 822 W 800 St N Unit LOT319
- 595 N 1200 E
- 6692 W 9770 N
- 602 W 860 N
- 418 N 1322 E
- 471 W 1040 N
- 425 W 1120 N
- 735 N 1000 E
- 987 N 410 W
- 962 N 780 St W Unit 508
- 1072 N 1710 E
- 1122 N 1710 E Unit 28
- 1689 E 1060 N Unit 25
- 1079 N 1800 E
- 1058 N 1710 E
- 1125 N 1710 E Unit 27
- 1119 N 1710 E Unit 26
- 1049 N 1710 E
- 1663 E 1060 N
- 1032 N 1710 E Unit 51
- 1126 N 1610 E
- 1025 N 1710 E
- 1025 N 1710 E Unit 46
- 1660 E 1060 N Unit 31
- 1002 N 1710 E
- 1635 E 1060 N
- 1148 N 1610 E
- 999 N 1710 E
- 1638 E 1060 N
- 9241 N 6800 W