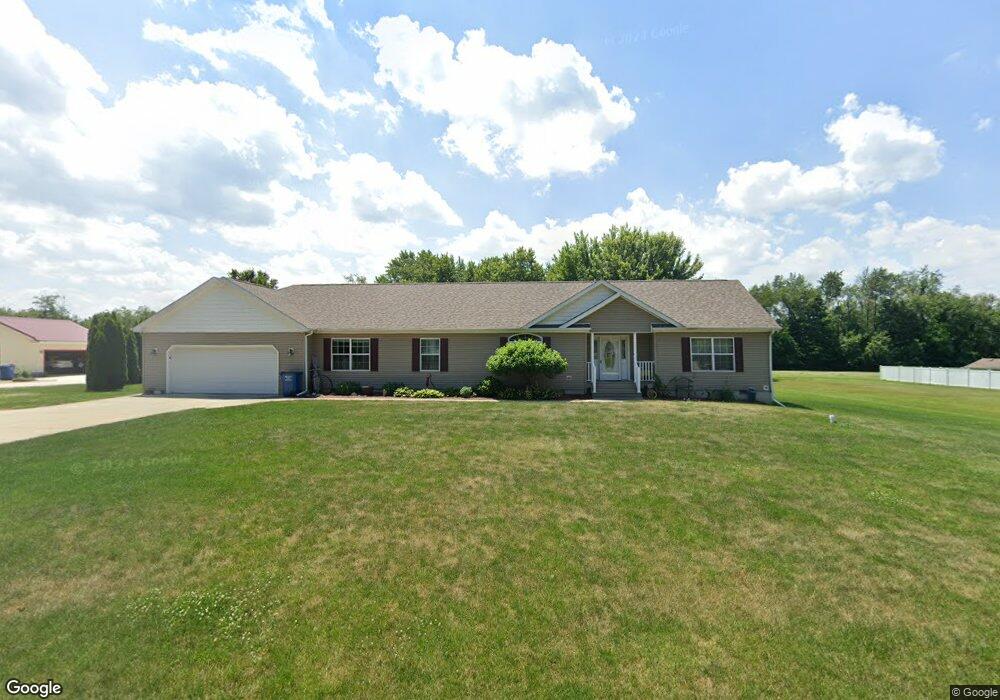
1094 W 300 N La Porte, IN 46350
Estimated Value: $270,968 - $348,000
3
Beds
2
Baths
1,796
Sq Ft
$177/Sq Ft
Est. Value
About This Home
This home is located at 1094 W 300 N, La Porte, IN 46350 and is currently estimated at $318,742, approximately $177 per square foot. 1094 W 300 N is a home with nearby schools including Prescott Elementary School, F. Willard Crichfield Elementary School, and La Porte High School.
Ownership History
Date
Name
Owned For
Owner Type
Purchase Details
Closed on
Nov 19, 2021
Sold by
Jeffers Linda S
Bought by
Chavez Corey and Chavez Amanda R
Current Estimated Value
Home Financials for this Owner
Home Financials are based on the most recent Mortgage that was taken out on this home.
Original Mortgage
$254,727
Outstanding Balance
$233,413
Interest Rate
2.99%
Mortgage Type
VA
Estimated Equity
$85,329
Purchase Details
Closed on
Dec 21, 2012
Sold by
Jeffers Roger G and Jeffers Linda S
Bought by
Jeffers Roger G and Jeffers Linda S
Home Financials for this Owner
Home Financials are based on the most recent Mortgage that was taken out on this home.
Original Mortgage
$184,970
Interest Rate
3.38%
Mortgage Type
FHA
Purchase Details
Closed on
Oct 17, 2008
Sold by
Vantage Investments Inc
Bought by
Jeffers Roger G and Jeffers Linda S
Home Financials for this Owner
Home Financials are based on the most recent Mortgage that was taken out on this home.
Original Mortgage
$187,450
Interest Rate
5.94%
Mortgage Type
Balloon
Create a Home Valuation Report for This Property
The Home Valuation Report is an in-depth analysis detailing your home's value as well as a comparison with similar homes in the area
Home Values in the Area
Average Home Value in this Area
Purchase History
| Date | Buyer | Sale Price | Title Company |
|---|---|---|---|
| Chavez Corey | -- | None Available | |
| Jeffers Roger G | -- | Lsi Lps | |
| Jeffers Roger G | -- | Meridian Title Corp |
Source: Public Records
Mortgage History
| Date | Status | Borrower | Loan Amount |
|---|---|---|---|
| Open | Chavez Corey | $254,727 | |
| Previous Owner | Jeffers Roger G | $184,970 | |
| Previous Owner | Jeffers Roger G | $187,450 |
Source: Public Records
Tax History Compared to Growth
Tax History
| Year | Tax Paid | Tax Assessment Tax Assessment Total Assessment is a certain percentage of the fair market value that is determined by local assessors to be the total taxable value of land and additions on the property. | Land | Improvement |
|---|---|---|---|---|
| 2024 | $1,624 | $193,700 | $40,200 | $153,500 |
| 2022 | $1,381 | $168,800 | $26,800 | $142,000 |
| 2021 | $1,381 | $156,200 | $26,800 | $129,400 |
| 2020 | $1,410 | $156,200 | $26,800 | $129,400 |
| 2019 | $1,641 | $176,600 | $37,300 | $139,300 |
| 2018 | $1,482 | $161,700 | $26,700 | $135,000 |
| 2017 | $1,328 | $154,500 | $23,900 | $130,600 |
| 2016 | $896 | $122,700 | $23,700 | $99,000 |
| 2014 | $936 | $129,600 | $23,800 | $105,800 |
Source: Public Records
Map
Nearby Homes
- 865 W 200 N
- 0 N Kuchar Dr Unit NRA812041
- 0 W 250 N
- 3471 N Karen Kourt
- 3226 N Briar Leaf Ct
- 169 W Mcclung Rd Unit 201
- 169 W Mcclung Rd Unit 203
- 0 N Hwy 39 N Unit NRA813838
- 195 W Mcclung Rd
- 1944 Park St
- 1960 Park St
- 1964 Park St
- 1962 Park St
- 199 W Mcclung Rd
- 125 W Mcclung Rd
- 206 Outlook Cove Dr
- 306 Outlook Cove Dr
- 210 Yard Perfect Dr
- 190 Yard Perfect Dr
- 000 N US Highway 35 Rd