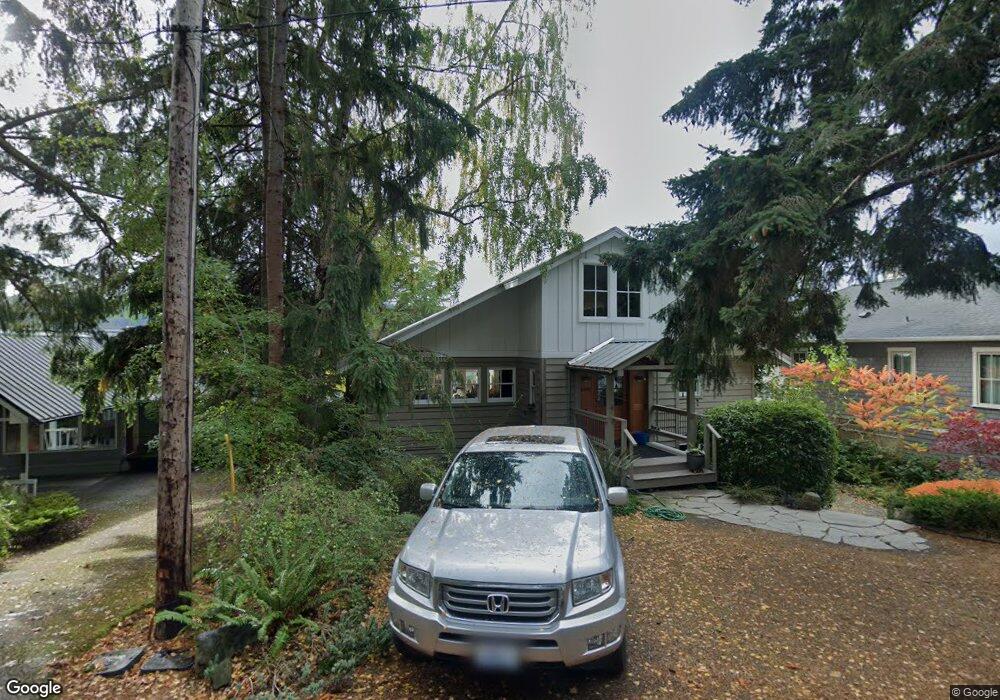
10945 NE Seaborn Rd Bainbridge Island, WA 98110
Estimated Value: $2,248,000 - $2,526,000
5
Beds
3
Baths
2,708
Sq Ft
$867/Sq Ft
Est. Value
About This Home
This home is located at 10945 NE Seaborn Rd, Bainbridge Island, WA 98110 and is currently estimated at $2,347,353, approximately $866 per square foot. 10945 NE Seaborn Rd is a home located in Kitsap County with nearby schools including Bainbridge High School, Montessori Country School, and Madrona School.
Ownership History
Date
Name
Owned For
Owner Type
Purchase Details
Closed on
Jan 21, 2021
Sold by
Corke Michael W
Bought by
Corke Michael and Corke Ellen
Current Estimated Value
Home Financials for this Owner
Home Financials are based on the most recent Mortgage that was taken out on this home.
Original Mortgage
$510,400
Outstanding Balance
$455,213
Interest Rate
2.67%
Mortgage Type
New Conventional
Estimated Equity
$1,892,140
Purchase Details
Closed on
Jan 6, 2005
Sold by
Lindorff Glenda J
Bought by
Corke Michael W
Purchase Details
Closed on
May 25, 1999
Sold by
Murray Stan
Bought by
Corke Michael W and Lindorff Glenda
Home Financials for this Owner
Home Financials are based on the most recent Mortgage that was taken out on this home.
Original Mortgage
$426,500
Interest Rate
6.84%
Create a Home Valuation Report for This Property
The Home Valuation Report is an in-depth analysis detailing your home's value as well as a comparison with similar homes in the area
Home Values in the Area
Average Home Value in this Area
Purchase History
| Date | Buyer | Sale Price | Title Company |
|---|---|---|---|
| Corke Michael | -- | Pacific Northwest Title | |
| Corke Michael W | -- | -- | |
| Corke Michael W | $540,000 | Transnation Title Ins Co |
Source: Public Records
Mortgage History
| Date | Status | Borrower | Loan Amount |
|---|---|---|---|
| Open | Corke Michael | $510,400 | |
| Previous Owner | Corke Michael W | $426,500 |
Source: Public Records
Tax History Compared to Growth
Tax History
| Year | Tax Paid | Tax Assessment Tax Assessment Total Assessment is a certain percentage of the fair market value that is determined by local assessors to be the total taxable value of land and additions on the property. | Land | Improvement |
|---|---|---|---|---|
| 2026 | $15,815 | $1,976,550 | $1,115,970 | $860,580 |
| 2025 | $15,815 | $1,976,550 | $1,115,970 | $860,580 |
| 2024 | $15,111 | $1,976,550 | $1,115,970 | $860,580 |
| 2023 | $14,256 | $1,782,280 | $1,005,380 | $776,900 |
| 2022 | $12,959 | $1,379,090 | $761,050 | $618,040 |
| 2021 | $12,627 | $1,281,010 | $706,690 | $574,320 |
| 2020 | $12,800 | $1,281,010 | $706,690 | $574,320 |
| 2019 | $11,229 | $1,144,720 | $630,580 | $514,140 |
| 2018 | $11,416 | $973,680 | $526,940 | $446,740 |
| 2017 | $10,069 | $973,680 | $526,940 | $446,740 |
| 2016 | $9,717 | $891,750 | $400,330 | $491,420 |
| 2015 | $8,817 | $811,100 | $362,930 | $448,170 |
| 2014 | -- | $718,340 | $321,140 | $397,200 |
| 2013 | -- | $718,340 | $321,140 | $397,200 |
Source: Public Records
Map
Nearby Homes
- 10403 NE Seaborn Rd
- 9721 NE Charisma Cir
- 10761 Bill Point Crest NE
- 0 NE Old Creosote Hill Rd
- 4740 NE Rose Ave NE
- 2372 Douglas Dr NE
- 11121 NE Brownell Ln
- 0 Lot 9 Park View Dr NE
- 0 Devenny Ave NE Unit NWM2324546
- 1574 Park View Dr NE Unit 1
- 0 Mardell (Lot 11) Ct Unit NWM1856637
- 0 Mardell (Lot 12) Ct Unit NWM1856638
- 0 Mardell (Lot 6) Ct Unit NWM1768026
- 0 Mardell (Lot 7) Ct Unit 1759157
- 141 Parfitt Way SW Unit M-10
- 4420 Bluff Ln NE
- 465 Winslow Way E Unit 108
- 4869 Rosalind Rd NE
- 4205 Pleasant Beach Dr NE
- 1237 Hawley Way NE
- 10941 NE Seaborn Rd
- 10969 NE Seaborn Rd
- 10897 NE Seaborn Rd
- 10877 NE Seaborn Rd
- 11024 NE Seaborn Rd
- 0 Resultant H Halls Hill Unit 1800426
- 11050 NE Seaborn Rd
- 10745 NE Seaborn Rd
- 10683 NE Seaborn Rd
- 10671 NE Seaborn Rd
- 10669 NE Seaborn Rd
- 10653 NE Seaborn Rd
- 11122 NE Halls Hill Rd
- 50725 RE Undisclosed
- 4045 Rockaway Beach Rd NE
- 10601 NE Seaborn Rd
- 10705 NE Halls Hill Rd
- 10705 NE Halls Hill Rd
- 10821 NE Wacky Nut Way
- 0 LOT K NE Seaborn Rd