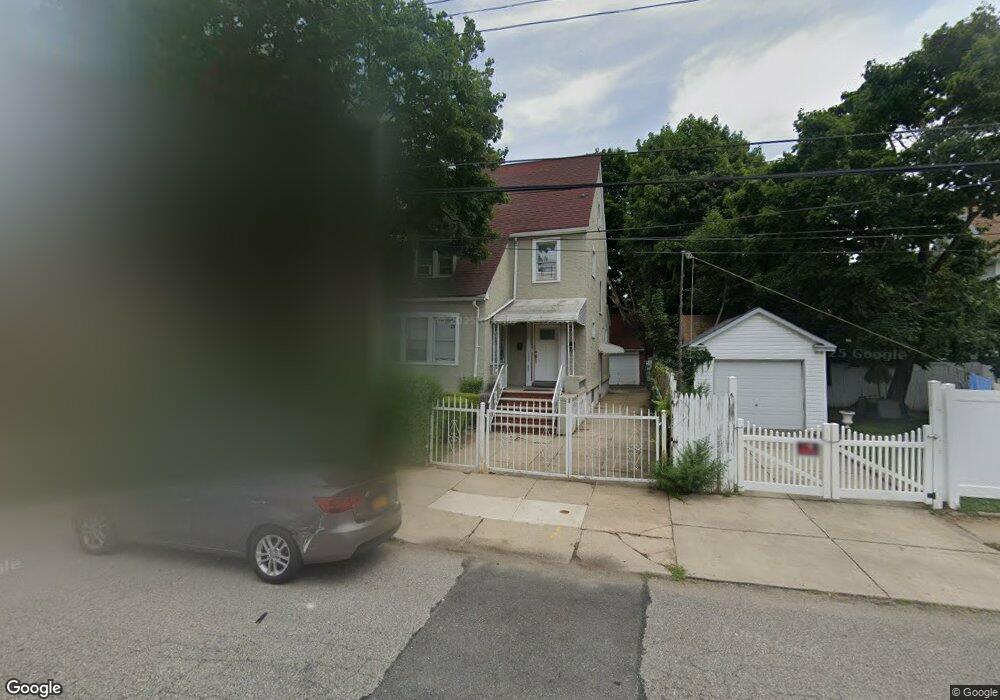
10949 215th St Unit 2 Queens Village, NY 11429
Queens Village NeighborhoodEstimated Value: $856,738 - $1,135,000
3
Beds
1
Bath
2,092
Sq Ft
$493/Sq Ft
Est. Value
About This Home
This home is located at 10949 215th St Unit 2, Queens Village, NY 11429 and is currently estimated at $1,032,185, approximately $493 per square foot. 10949 215th St Unit 2 is a home located in Queens County with nearby schools including P.S. 34 John Harvard, Jean Nuzzi Intermediate School, and Ss Joachim & Anne School.
Ownership History
Date
Name
Owned For
Owner Type
Purchase Details
Closed on
Jun 21, 2023
Sold by
Stuart215 Llc
Bought by
Stuart Chantel
Current Estimated Value
Home Financials for this Owner
Home Financials are based on the most recent Mortgage that was taken out on this home.
Original Mortgage
$704,110
Outstanding Balance
$685,282
Interest Rate
6.39%
Mortgage Type
Purchase Money Mortgage
Estimated Equity
$346,903
Purchase Details
Closed on
Oct 12, 2022
Sold by
Stuart Ariana M and Stuart Chantel
Bought by
Stuart215 Llc
Home Financials for this Owner
Home Financials are based on the most recent Mortgage that was taken out on this home.
Original Mortgage
$400,000
Interest Rate
5.66%
Mortgage Type
Purchase Money Mortgage
Purchase Details
Closed on
Jan 19, 2021
Sold by
Clarence L Stuart Jr Estate and Stuart
Bought by
Stuart Ariana M and Stuart Chantel
Purchase Details
Closed on
Jan 16, 1998
Sold by
Stuart Ronald G and Stuart Clarence L
Bought by
Stuart Clarence L
Create a Home Valuation Report for This Property
The Home Valuation Report is an in-depth analysis detailing your home's value as well as a comparison with similar homes in the area
Home Values in the Area
Average Home Value in this Area
Purchase History
| Date | Buyer | Sale Price | Title Company |
|---|---|---|---|
| Stuart Chantel | -- | -- | |
| Stuart Pamela | $850,000 | -- | |
| Stuart Chantel | -- | -- | |
| Stuart215 Llc | -- | -- | |
| Stuart215 Llc | -- | -- | |
| Stuart Ariana M | -- | -- | |
| Stuart Ariana M | -- | -- | |
| Stuart Clarence L | $4,500 | -- | |
| Stuart Clarence L | -- | -- |
Source: Public Records
Mortgage History
| Date | Status | Borrower | Loan Amount |
|---|---|---|---|
| Open | Stuart Pamela | $704,110 | |
| Closed | Stuart Chantel | $704,110 | |
| Previous Owner | Stuart215 Llc | $400,000 |
Source: Public Records
Tax History Compared to Growth
Tax History
| Year | Tax Paid | Tax Assessment Tax Assessment Total Assessment is a certain percentage of the fair market value that is determined by local assessors to be the total taxable value of land and additions on the property. | Land | Improvement |
|---|---|---|---|---|
| 2025 | $6,768 | $35,718 | $9,859 | $25,859 |
| 2024 | $6,768 | $33,696 | $10,845 | $22,851 |
| 2023 | $6,768 | $33,696 | $9,638 | $24,058 |
| 2022 | $6,676 | $44,640 | $15,120 | $29,520 |
| 2021 | $6,640 | $47,760 | $15,120 | $32,640 |
| 2020 | $6,300 | $42,360 | $15,120 | $27,240 |
| 2019 | $5,874 | $46,680 | $15,120 | $31,560 |
| 2018 | $5,724 | $28,080 | $11,395 | $16,685 |
| 2017 | $5,681 | $27,869 | $12,863 | $15,006 |
| 2016 | $5,256 | $27,869 | $12,863 | $15,006 |
| 2015 | $3,469 | $24,804 | $14,840 | $9,964 |
| 2014 | $3,469 | $23,400 | $16,800 | $6,600 |
Source: Public Records
Map
Nearby Homes
- 109-09 215th St
- 109-49 215th St
- 21607 110th Ave
- 106-16 215th St
- 106-14 217th St
- 106-10 217th St
- 104 39 210 St
- 225 15 106th Ave
- 104-37 214th St
- 10418 216th St
- 110-17 Monterey St
- 11034 214th St
- 216-23 111th Ave
- 11028 213th St
- 109-28 212th St
- 107-05 Monterey St
- 107-01 Monterey St
- 21609 104th Ave
- 217-05 104th Ave
- 11119 212th St
- 10949 215th St
- 10949 215th St Unit 1st Fl
- 10949 215th St Unit 1Fl
- 10949 215th St
- 10949 215th St
- 10945 215th St
- 10945 215th St
- 10945 215th St
- 21501 110th Ave
- 21505 110th Ave
- 21511 110th Ave
- 10941 215th St
- 10950 216th St
- 10946 216th St
- 21515 110th Ave
- 215-01 110th Ave
- 10940 216th St
- 10956 215th St
- 109-56 215th St Unit D
- 109-56 215th St Unit C