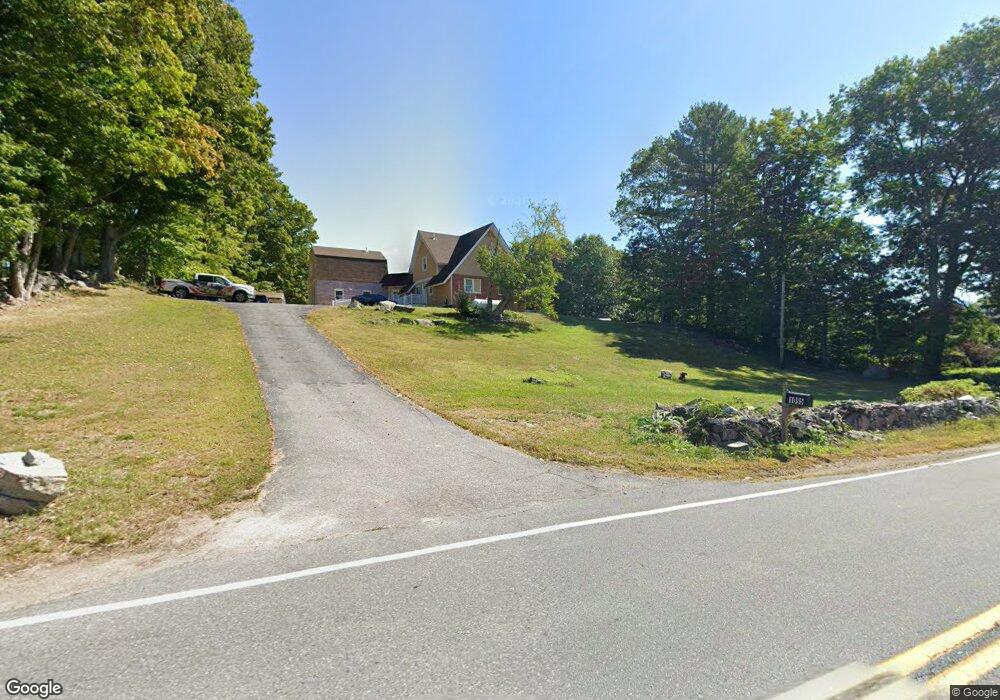
1095 Main St Dunstable, MA 01827
Estimated Value: $560,000 - $761,119
4
Beds
3
Baths
2,959
Sq Ft
$213/Sq Ft
Est. Value
About This Home
This home is located at 1095 Main St, Dunstable, MA 01827 and is currently estimated at $629,530, approximately $212 per square foot. 1095 Main St is a home located in Middlesex County with nearby schools including Groton Dunstable Regional High School and 2nd Nature Academy.
Ownership History
Date
Name
Owned For
Owner Type
Purchase Details
Closed on
Feb 26, 2025
Sold by
Flagstar Bank
Bought by
Kihiko Timothy C
Current Estimated Value
Home Financials for this Owner
Home Financials are based on the most recent Mortgage that was taken out on this home.
Original Mortgage
$440,000
Outstanding Balance
$437,451
Interest Rate
7.04%
Mortgage Type
Purchase Money Mortgage
Estimated Equity
$192,079
Purchase Details
Closed on
Dec 2, 2024
Sold by
Muturi Susan and Flagstar Bank Na
Bought by
Flagstar Bank Na
Purchase Details
Closed on
Nov 14, 2023
Sold by
Muturi Susan
Bought by
Rombo Rt
Purchase Details
Closed on
Jun 22, 2018
Sold by
Kihiko Lassanah Llc
Bought by
Muturi Susan
Home Financials for this Owner
Home Financials are based on the most recent Mortgage that was taken out on this home.
Original Mortgage
$417,302
Interest Rate
4.5%
Mortgage Type
FHA
Purchase Details
Closed on
Mar 29, 2017
Sold by
Esancy Gary and Morrill Theresa
Bought by
Kihiko Lassanach Llc
Home Financials for this Owner
Home Financials are based on the most recent Mortgage that was taken out on this home.
Original Mortgage
$290,000
Interest Rate
4.15%
Mortgage Type
New Conventional
Purchase Details
Closed on
Jan 9, 2014
Sold by
Esancy Gary
Bought by
Esancy Gary and Morrill Theresa
Purchase Details
Closed on
Apr 19, 2013
Sold by
Prestons Motor Sales I
Bought by
Easncy Gary
Purchase Details
Closed on
Jun 11, 1982
Bought by
Esancy Gary and Morrill Theresa
Create a Home Valuation Report for This Property
The Home Valuation Report is an in-depth analysis detailing your home's value as well as a comparison with similar homes in the area
Home Values in the Area
Average Home Value in this Area
Purchase History
| Date | Buyer | Sale Price | Title Company |
|---|---|---|---|
| Kihiko Timothy C | $550,000 | None Available | |
| Kihiko Timothy C | $550,000 | None Available | |
| Flagstar Bank Na | $542,235 | None Available | |
| Flagstar Bank Na | $542,235 | None Available | |
| Flagstar Bank Na | $542,235 | None Available | |
| Rombo Rt | -- | None Available | |
| Rombo Rt | -- | None Available | |
| Rombo Rt | -- | None Available | |
| Muturi Susan | $425,000 | -- | |
| Muturi Susan | $425,000 | -- | |
| Kihiko Lassanach Llc | $280,000 | -- | |
| Kihiko Lassanach Llc | $280,000 | -- | |
| Esancy Gary | -- | -- | |
| Easncy Gary | -- | -- | |
| Esancy Gary | -- | -- | |
| Muturi Susan | $425,000 | -- | |
| Kihiko Lassanach Llc | $280,000 | -- | |
| Esancy Gary | -- | -- | |
| Easncy Gary | -- | -- |
Source: Public Records
Mortgage History
| Date | Status | Borrower | Loan Amount |
|---|---|---|---|
| Open | Kihiko Timothy C | $440,000 | |
| Closed | Kihiko Timothy C | $440,000 | |
| Previous Owner | Muturi Susan | $417,302 | |
| Previous Owner | Kihiko Lassanach Llc | $290,000 |
Source: Public Records
Tax History
| Year | Tax Paid | Tax Assessment Tax Assessment Total Assessment is a certain percentage of the fair market value that is determined by local assessors to be the total taxable value of land and additions on the property. | Land | Improvement |
|---|---|---|---|---|
| 2025 | $7,623 | $554,400 | $221,000 | $333,400 |
| 2024 | $7,363 | $527,400 | $202,700 | $324,700 |
| 2023 | $7,428 | $496,200 | $202,700 | $293,500 |
| 2022 | $7,238 | $474,600 | $202,700 | $271,900 |
| 2021 | $7,027 | $428,200 | $185,400 | $242,800 |
| 2020 | $7,128 | $423,300 | $185,400 | $237,900 |
| 2019 | $7,000 | $410,300 | $185,400 | $224,900 |
| 2018 | $6,158 | $351,100 | $184,400 | $166,700 |
| 2017 | $5,959 | $350,100 | $184,400 | $165,700 |
| 2016 | $5,693 | $344,000 | $176,200 | $167,800 |
| 2015 | $5,390 | $322,200 | $148,500 | $173,700 |
| 2014 | $5,100 | $323,400 | $148,500 | $174,900 |
Source: Public Records
Map
Nearby Homes
- 121 Cherrywood Dr
- 1 Doucet Ave
- 77 Wilderness Dr
- 7 Wilderness Dr
- 2 Wilderness Dr
- 3 Wilderness Dr
- 79 Wilderness Dr
- 6 Wilderness Dr
- 1 Wilderness Dr
- 57 Wilderness Dr
- 61 Wilderness Dr
- 59 Wilderness Dr
- 4 Wilderness Dr
- 6 Testament Cir Unit 5
- 58 Wilderness Dr
- 65 Wilderness Dr
- 4 Hikers Ln
- 8 Hikers Ln
- 141 Ridge Rd
- 8 Wilderness Dr
Your Personal Tour Guide
Ask me questions while you tour the home.