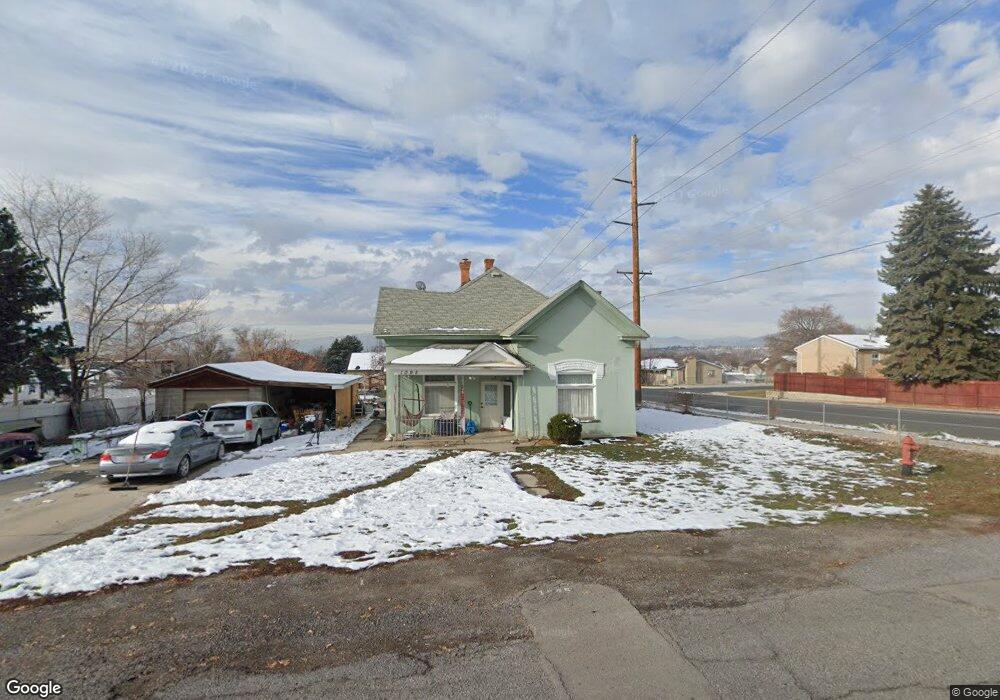
1095 N 400 E Pleasant Grove, UT 84062
Estimated Value: $423,000 - $490,000
2
Beds
1
Bath
1,381
Sq Ft
$332/Sq Ft
Est. Value
About This Home
This home is located at 1095 N 400 E, Pleasant Grove, UT 84062 and is currently estimated at $458,123, approximately $331 per square foot. 1095 N 400 E is a home located in Utah County with nearby schools including Grovecrest Elementary School, Pleasant Grove Junior High School, and Pleasant Grove High School.
Ownership History
Date
Name
Owned For
Owner Type
Purchase Details
Closed on
Sep 19, 2006
Sold by
Naugle Andrew L and Naugle Stephen A
Bought by
Blake Thomas A and Blake Emilee
Current Estimated Value
Purchase Details
Closed on
Aug 26, 2004
Sold by
Hone M Kent and Hone Amy M
Bought by
Naugle Andrew L and Naugle Stephen A
Home Financials for this Owner
Home Financials are based on the most recent Mortgage that was taken out on this home.
Original Mortgage
$125,037
Interest Rate
5.95%
Mortgage Type
FHA
Purchase Details
Closed on
Apr 25, 1997
Sold by
Sorensen Grace L
Bought by
Hone M Kent and Hone Amy M
Home Financials for this Owner
Home Financials are based on the most recent Mortgage that was taken out on this home.
Original Mortgage
$101,266
Interest Rate
7.86%
Mortgage Type
FHA
Create a Home Valuation Report for This Property
The Home Valuation Report is an in-depth analysis detailing your home's value as well as a comparison with similar homes in the area
Home Values in the Area
Average Home Value in this Area
Purchase History
| Date | Buyer | Sale Price | Title Company |
|---|---|---|---|
| Blake Thomas A | -- | First American Title Agency | |
| Naugle Andrew L | -- | Inwest Title Services Inc | |
| Hone M Kent | -- | -- |
Source: Public Records
Mortgage History
| Date | Status | Borrower | Loan Amount |
|---|---|---|---|
| Previous Owner | Naugle Andrew L | $125,037 | |
| Previous Owner | Hone M Kent | $101,266 |
Source: Public Records
Tax History Compared to Growth
Tax History
| Year | Tax Paid | Tax Assessment Tax Assessment Total Assessment is a certain percentage of the fair market value that is determined by local assessors to be the total taxable value of land and additions on the property. | Land | Improvement |
|---|---|---|---|---|
| 2025 | $1,664 | $204,160 | $223,800 | $147,400 |
| 2024 | $1,664 | $194,205 | $0 | $0 |
| 2023 | $1,568 | $191,510 | $0 | $0 |
| 2022 | $1,692 | $205,645 | $0 | $0 |
| 2021 | $1,455 | $269,400 | $160,600 | $108,800 |
| 2020 | $1,335 | $242,300 | $143,400 | $98,900 |
| 2019 | $1,161 | $217,800 | $131,800 | $86,000 |
| 2018 | $1,107 | $196,500 | $120,100 | $76,400 |
| 2017 | $1,032 | $97,460 | $0 | $0 |
| 2016 | $967 | $88,165 | $0 | $0 |
| 2015 | $1,021 | $88,165 | $0 | $0 |
| 2014 | $1,015 | $86,845 | $0 | $0 |
Source: Public Records
Map
Nearby Homes