Estimated Value: $92,000 - $151,902
2
Beds
2
Baths
962
Sq Ft
$137/Sq Ft
Est. Value
About This Home
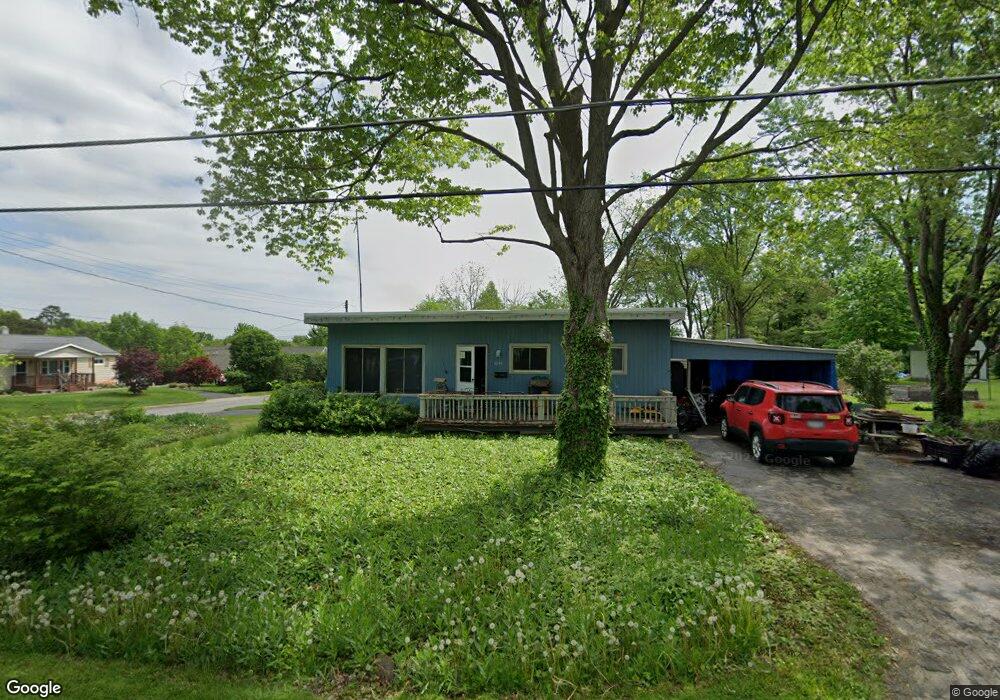
This home is located at 1095 Overlook Dr, Salem, OH 44460 and is currently estimated at $131,976, approximately $137 per square foot. 1095 Overlook Dr is a home located in Columbiana County with nearby schools including Reilly Elementary School, Buckeye Elementary School, and Salem Junior High School.
Ownership History
Date
Name
Owned For
Owner Type
Purchase Details
Closed on
Jul 18, 2024
Sold by
Kincade Donis F
Bought by
Stamp Christopher M and Stamp Julie A
Current Estimated Value
Home Financials for this Owner
Home Financials are based on the most recent Mortgage that was taken out on this home.
Original Mortgage
$112,500
Outstanding Balance
$102,710
Interest Rate
6.29%
Mortgage Type
Credit Line Revolving
Estimated Equity
$29,266
Purchase Details
Closed on
Sep 9, 2022
Bought by
Donis F Kincade
Purchase Details
Closed on
Jul 21, 2016
Sold by
Bank Of America National Assocaition
Bought by
Kincade James E
Purchase Details
Closed on
Dec 30, 1993
Bought by
Wilkinson David A
Purchase Details
Closed on
Jun 30, 1993
Sold by
Wilkinson David A
Bought by
Mancuso John C
Create a Home Valuation Report for This Property
The Home Valuation Report is an in-depth analysis detailing your home's value as well as a comparison with similar homes in the area
Home Values in the Area
Average Home Value in this Area
Purchase History
| Date | Buyer | Sale Price | Title Company |
|---|---|---|---|
| Stamp Christopher M | $150,000 | None Listed On Document | |
| Stamp Christopher M | $150,000 | None Listed On Document | |
| Donis F Kincade | -- | -- | |
| Kincade James E | $18,000 | None Available | |
| Wilkinson David A | $43,500 | -- | |
| Mancuso John C | -- | -- |
Source: Public Records
Mortgage History
| Date | Status | Borrower | Loan Amount |
|---|---|---|---|
| Open | Stamp Christopher M | $112,500 | |
| Closed | Stamp Christopher M | $112,500 |
Source: Public Records
Tax History Compared to Growth
Tax History
| Year | Tax Paid | Tax Assessment Tax Assessment Total Assessment is a certain percentage of the fair market value that is determined by local assessors to be the total taxable value of land and additions on the property. | Land | Improvement |
|---|---|---|---|---|
| 2024 | $1,130 | $26,460 | $5,600 | $20,860 |
| 2023 | $1,133 | $26,460 | $5,600 | $20,860 |
| 2022 | $1,055 | $26,460 | $5,600 | $20,860 |
| 2021 | $888 | $20,690 | $5,430 | $15,260 |
| 2020 | $895 | $20,690 | $5,430 | $15,260 |
| 2019 | $895 | $20,690 | $5,430 | $15,260 |
| 2018 | $854 | $18,800 | $4,940 | $13,860 |
| 2017 | $854 | $18,800 | $4,940 | $13,860 |
| 2016 | $830 | $18,270 | $5,040 | $13,230 |
| 2015 | $1,085 | $18,270 | $5,040 | $13,230 |
| 2014 | $921 | $18,270 | $5,040 | $13,230 |
Source: Public Records
Map
Nearby Homes
- 937 Liberty St
- 944 Jones Dr
- 1180 Jones Dr
- 1358 Andrew Ave
- 935 W Pidgeon Rd
- 281 Idaho Ave
- 1750 Allen Dr
- 523 Bethel Dr
- 605 W 7th St
- 1759 Depot Rd
- 312 W Pidgeon Rd
- 631 W 8th St
- 174 W 5th St
- 152 & 158 W 5th St
- 478 N Ellsworth Ave
- 13147 Ohio 14
- 156 W Pidgeon Rd
- 492 N Ellsworth Ave
- 0 Maryland Ave
- 501 Stewart Rd
- 1071 W Perry St
- 0 Pidgeon Rd Unit 3682891
- 0 Pidgeon Rd Unit 3737466
- 0 Pidgeon Rd Unit 4159212
- 1109 W Perry St
- 1082 1/2 Liberty St
- 1068 Liberty St
- 1108 Liberty St
- 1018 Liberty St
- 1115 W Perry St Unit 1117
- 1070 W Perry St
- 1070 W Perry St
- 1108 W Perry St
- 1120 Liberty St
- 1016 Liberty St
- 1118 W Perry St Unit 1120
- 1129-1143 W Perry 2472 Lexington
- 1126 Liberty St
- 1004 Liberty St
- 1126 W Perry St Unit 1128