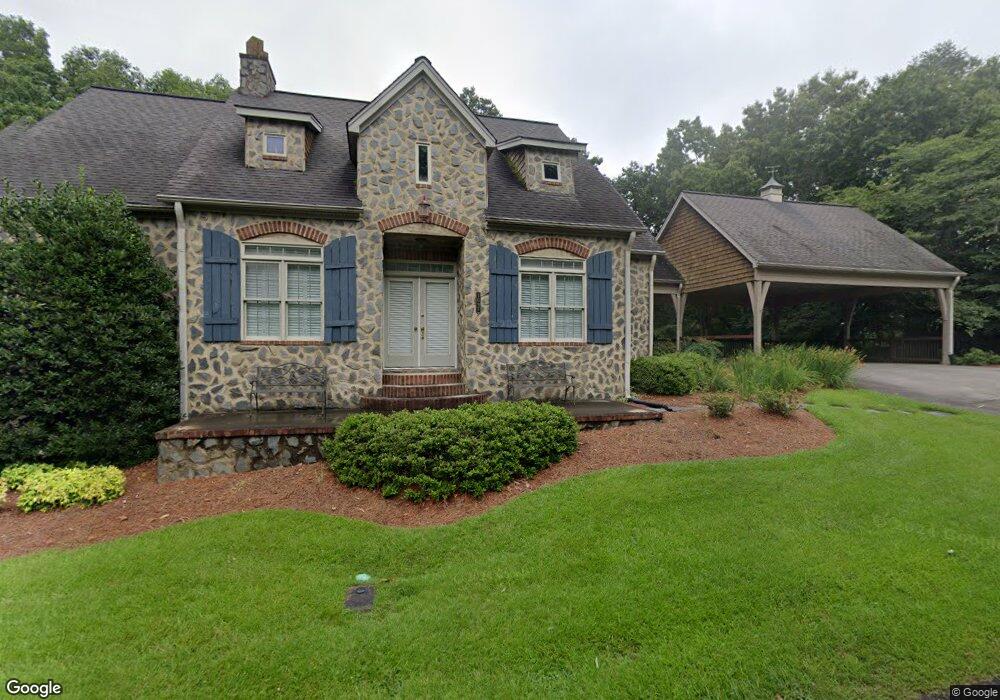
1095 Talona Mountain Rd Ellijay, GA 30536
Estimated Value: $611,000 - $708,000
--
Bed
3
Baths
2,775
Sq Ft
$239/Sq Ft
Est. Value
About This Home
This home is located at 1095 Talona Mountain Rd, Ellijay, GA 30536 and is currently estimated at $662,346, approximately $238 per square foot. 1095 Talona Mountain Rd is a home located in Gilmer County with nearby schools including Ellijay Elementary School, Clear Creek Elementary School, and Clear Creek Middle School.
Ownership History
Date
Name
Owned For
Owner Type
Purchase Details
Closed on
May 10, 2019
Sold by
Sharp W Scott
Bought by
Sharp Wallace S and Sharp Laura B
Current Estimated Value
Home Financials for this Owner
Home Financials are based on the most recent Mortgage that was taken out on this home.
Original Mortgage
$200,000
Outstanding Balance
$174,748
Interest Rate
4.1%
Mortgage Type
New Conventional
Estimated Equity
$487,598
Purchase Details
Closed on
Aug 31, 2012
Sold by
Sharp Herbert J
Bought by
Sharp W Scott
Purchase Details
Closed on
Apr 28, 2000
Sold by
Sharp Herbert J
Bought by
Sharp Herbert and Sharp Kay
Purchase Details
Closed on
Sep 30, 1999
Sold by
Miles Billy P
Bought by
Sharp Herbert J
Purchase Details
Closed on
Aug 1, 1987
Bought by
Miles Billy P
Purchase Details
Closed on
Jan 1, 1987
Bought by
Miles Billy P
Purchase Details
Closed on
Jan 1, 1986
Bought by
Miles Billy P
Create a Home Valuation Report for This Property
The Home Valuation Report is an in-depth analysis detailing your home's value as well as a comparison with similar homes in the area
Home Values in the Area
Average Home Value in this Area
Purchase History
| Date | Buyer | Sale Price | Title Company |
|---|---|---|---|
| Sharp Wallace S | -- | -- | |
| Sharp W Scott | -- | -- | |
| Sharp Herbert | -- | -- | |
| Sharp Herbert J | $30,000 | -- | |
| Miles Billy P | -- | -- | |
| Miles Billy P | -- | -- | |
| Miles Billy P | -- | -- |
Source: Public Records
Mortgage History
| Date | Status | Borrower | Loan Amount |
|---|---|---|---|
| Open | Sharp Wallace S | $200,000 |
Source: Public Records
Tax History Compared to Growth
Tax History
| Year | Tax Paid | Tax Assessment Tax Assessment Total Assessment is a certain percentage of the fair market value that is determined by local assessors to be the total taxable value of land and additions on the property. | Land | Improvement |
|---|---|---|---|---|
| 2025 | $3,451 | $287,160 | $33,600 | $253,560 |
| 2024 | $3,451 | $278,040 | $27,000 | $251,040 |
| 2023 | $3,420 | $263,160 | $24,000 | $239,160 |
| 2022 | $3,088 | $198,160 | $20,240 | $177,920 |
| 2021 | $3,006 | $160,720 | $16,200 | $144,520 |
| 2020 | $3,086 | $143,200 | $16,200 | $127,000 |
| 2019 | $3,178 | $143,200 | $16,200 | $127,000 |
| 2018 | $3,223 | $140,480 | $13,480 | $127,000 |
| 2017 | $3,104 | $126,160 | $13,480 | $112,680 |
| 2016 | $3,200 | $127,480 | $13,480 | $114,000 |
| 2015 | $2,178 | $88,360 | $12,000 | $76,360 |
| 2014 | $2,268 | $88,520 | $12,000 | $76,520 |
| 2013 | -- | $91,840 | $12,000 | $79,840 |
Source: Public Records
Map
Nearby Homes
- 201 Talona Lake Terrace
- Lot 34 Talona Mountain Rd Unit 34
- LOT T-5 Talona Mountain Rd
- Lot 36 Talona Mountain Rd
- Lot 34 Talona Mountain Rd
- Lot 36 Talona Mountain Rd Unit 34
- 0 Talona Rd Unit 10652283
- 000 Talona Rd
- 00 Wildwood Trail
- 146 Hackney Trail
- 81 Loper Ln
- 1107 Orchard Rd
- 0 John Call Rd
- 2089 John Call Rd
- 152 Wendy Hill Rd
- 0 Highland Ridge Rd Unit 7512956
- 224 Timber Ridge Ln
- 78 Highwoods #3-5057 Trail
- 78 Highwoods Trail
- 78 Highwoods Trail Unit 3-5057
- 1061 Talona Mountain Rd
- 1135 Talona Mountain Rd
- 1135 Talona Mountain Rd Unit 35
- 1135 Talona Mountain Rd
- 1148 Talona Rd Unit 34 AND 36
- 1148 Talona Rd Unit Lot 36
- 1148 Talona Rd
- 1148 Talona Mountain Rd
- 1042 Talona Mountain Rd
- L 37 Talona Mountain Rd
- LT 32 Talona Mountain Rd
- 7 & 8 Talona Mountain Rd
- 52 Talona Mountain Rd
- 1166 Talona Mountain Rd
- 1171 Talona Mountain Rd
- 981 Talona Mountain Rd
- 1015 Talona Mountain Rd
- LOT34 Talona Rd Unit Lot 34
- 984 Talona Mountain Rd
- 1014 Talona Rd