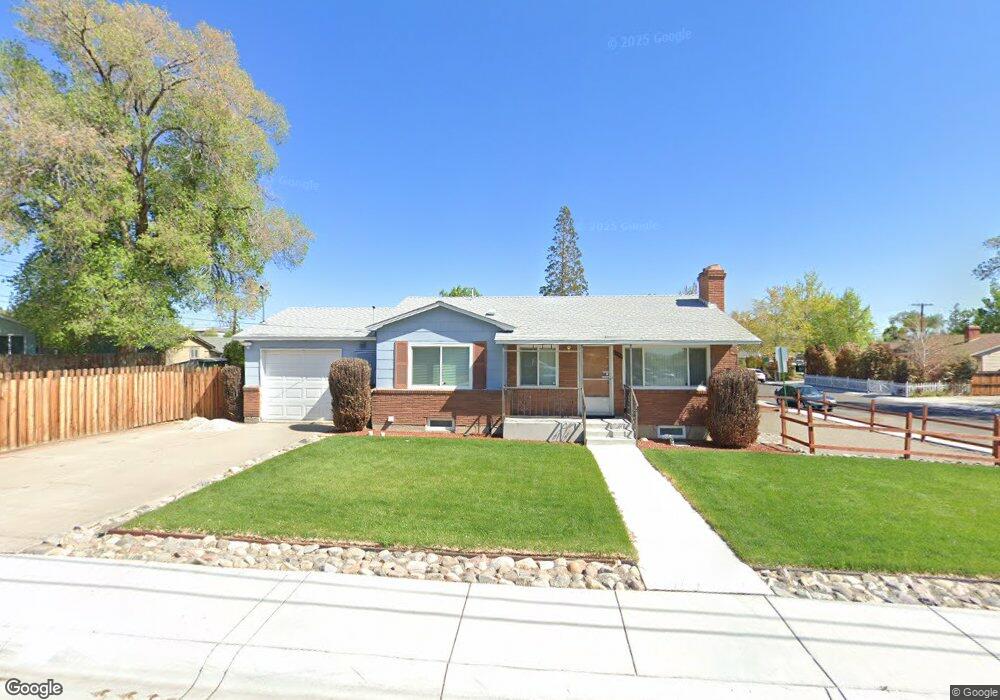
1095 Thoma St Reno, NV 89502
Wells Avenue District NeighborhoodEstimated Value: $339,000 - $430,000
2
Beds
2
Baths
849
Sq Ft
$467/Sq Ft
Est. Value
About This Home
This home is located at 1095 Thoma St, Reno, NV 89502 and is currently estimated at $396,454, approximately $466 per square foot. 1095 Thoma St is a home located in Washoe County with nearby schools including Libby C Booth Elementary School, Vaughn Middle School, and Earl Wooster High School.
Ownership History
Date
Name
Owned For
Owner Type
Purchase Details
Closed on
May 21, 2019
Sold by
Mello Donald J and Mello Elena P
Bought by
Mello Donald J and Mello Elena P
Current Estimated Value
Purchase Details
Closed on
Jan 26, 2018
Sold by
Mello Donald J and Mello Elena P
Bought by
Mello Jennifer R
Purchase Details
Closed on
Mar 30, 2001
Sold by
Ruggiero Robert L and Childers Jerold T
Bought by
Mello Donald J and Mello Elena P
Home Financials for this Owner
Home Financials are based on the most recent Mortgage that was taken out on this home.
Original Mortgage
$18,000
Outstanding Balance
$6,719
Interest Rate
7.19%
Mortgage Type
Seller Take Back
Estimated Equity
$389,735
Purchase Details
Closed on
Sep 9, 1997
Sold by
Depoali Harold J and Ghiggeri John
Bought by
Ruggiero Robert L and Childers Jerold T
Home Financials for this Owner
Home Financials are based on the most recent Mortgage that was taken out on this home.
Original Mortgage
$78,000
Interest Rate
4.95%
Create a Home Valuation Report for This Property
The Home Valuation Report is an in-depth analysis detailing your home's value as well as a comparison with similar homes in the area
Home Values in the Area
Average Home Value in this Area
Purchase History
| Date | Buyer | Sale Price | Title Company |
|---|---|---|---|
| Mello Donald J | -- | None Available | |
| Mello Jennifer R | -- | None Available | |
| Mello Donald J | $48,500 | First Centennial Title Co | |
| Ruggiero Robert L | $108,000 | First Centennial Title Co |
Source: Public Records
Mortgage History
| Date | Status | Borrower | Loan Amount |
|---|---|---|---|
| Open | Mello Donald J | $18,000 | |
| Previous Owner | Ruggiero Robert L | $78,000 |
Source: Public Records
Tax History Compared to Growth
Tax History
| Year | Tax Paid | Tax Assessment Tax Assessment Total Assessment is a certain percentage of the fair market value that is determined by local assessors to be the total taxable value of land and additions on the property. | Land | Improvement |
|---|---|---|---|---|
| 2025 | $904 | $53,746 | $34,265 | $19,481 |
| 2024 | $904 | $52,213 | $33,040 | $19,173 |
| 2023 | $878 | $51,047 | $33,390 | $17,657 |
| 2022 | $819 | $42,261 | $27,825 | $14,436 |
| 2021 | $756 | $32,355 | $18,270 | $14,085 |
| 2020 | $710 | $32,918 | $19,040 | $13,878 |
| 2019 | $679 | $29,734 | $16,660 | $13,074 |
| 2018 | $649 | $24,553 | $12,005 | $12,548 |
| 2017 | $626 | $22,747 | $10,430 | $12,317 |
| 2016 | $607 | $21,490 | $9,275 | $12,215 |
| 2015 | $618 | $19,467 | $7,350 | $12,117 |
| 2014 | $592 | $16,763 | $5,250 | $11,513 |
| 2013 | -- | $15,260 | $4,025 | $11,235 |
Source: Public Records
Map
Nearby Homes