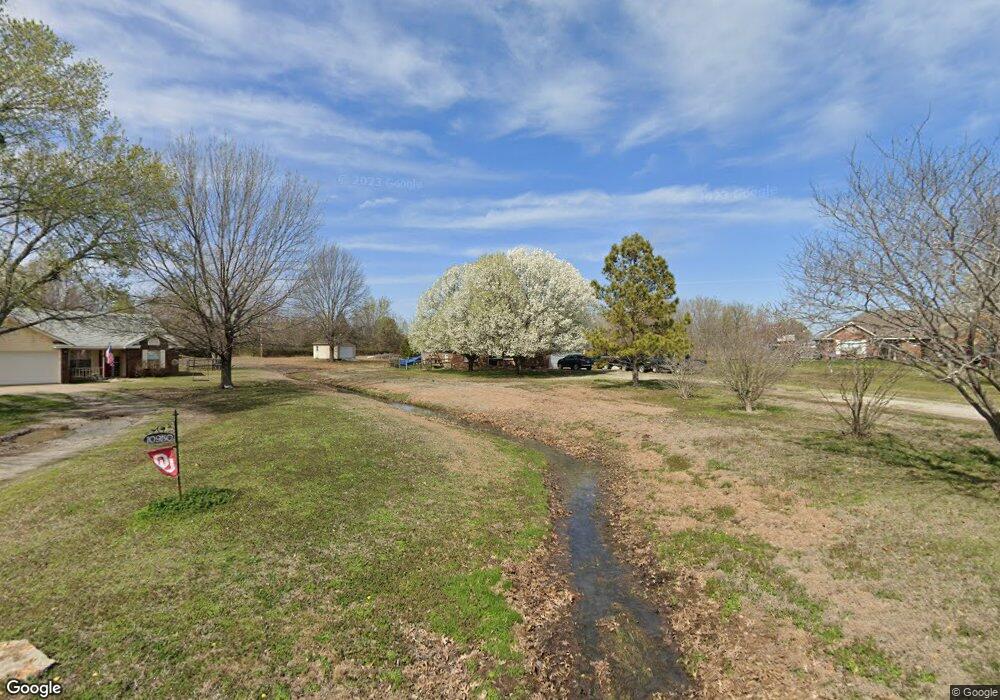
10951 E Weston Ln Claremore, OK 74019
Estimated Value: $230,861 - $265,000
3
Beds
2
Baths
1,422
Sq Ft
$174/Sq Ft
Est. Value
About This Home
This home is located at 10951 E Weston Ln, Claremore, OK 74019 and is currently estimated at $247,715, approximately $174 per square foot. 10951 E Weston Ln is a home located in Rogers County with nearby schools including Catalayah Elementary School, Will Rogers Junior High School, and Claremore High School.
Ownership History
Date
Name
Owned For
Owner Type
Purchase Details
Closed on
Sep 16, 2010
Sold by
Fowler Monte D
Bought by
Cordrey Ii Clyde F
Current Estimated Value
Home Financials for this Owner
Home Financials are based on the most recent Mortgage that was taken out on this home.
Original Mortgage
$128,345
Outstanding Balance
$84,504
Interest Rate
4.46%
Mortgage Type
New Conventional
Estimated Equity
$163,211
Purchase Details
Closed on
Jan 13, 2006
Sold by
Galloway Raymond D
Bought by
Fowler Monte D and Brewer Fowler Lisa Annette
Home Financials for this Owner
Home Financials are based on the most recent Mortgage that was taken out on this home.
Original Mortgage
$97,600
Interest Rate
6.25%
Mortgage Type
New Conventional
Purchase Details
Closed on
Jan 15, 1999
Sold by
Dorsey Inc
Purchase Details
Closed on
Sep 29, 1998
Sold by
Dorsey Terry L
Create a Home Valuation Report for This Property
The Home Valuation Report is an in-depth analysis detailing your home's value as well as a comparison with similar homes in the area
Home Values in the Area
Average Home Value in this Area
Purchase History
| Date | Buyer | Sale Price | Title Company |
|---|---|---|---|
| Cordrey Ii Clyde F | $130,000 | -- | |
| Fowler Monte D | $121,333 | First American Title & Abstr | |
| -- | $85,000 | -- | |
| -- | -- | -- |
Source: Public Records
Mortgage History
| Date | Status | Borrower | Loan Amount |
|---|---|---|---|
| Open | Cordrey Ii Clyde F | $128,345 | |
| Previous Owner | Fowler Monte D | $97,600 |
Source: Public Records
Tax History Compared to Growth
Tax History
| Year | Tax Paid | Tax Assessment Tax Assessment Total Assessment is a certain percentage of the fair market value that is determined by local assessors to be the total taxable value of land and additions on the property. | Land | Improvement |
|---|---|---|---|---|
| 2025 | $2,081 | $19,063 | $2,689 | $16,374 |
| 2024 | $1,865 | $18,155 | $2,561 | $15,594 |
| 2023 | $1,865 | $17,290 | $2,475 | $14,815 |
| 2022 | $1,740 | $16,917 | $2,475 | $14,442 |
| 2021 | $1,589 | $16,112 | $2,475 | $13,637 |
| 2020 | $1,631 | $16,008 | $2,475 | $13,533 |
| 2019 | $1,570 | $15,255 | $2,475 | $12,780 |
| 2018 | $1,608 | $15,656 | $2,475 | $13,181 |
| 2017 | $1,584 | $15,528 | $2,475 | $13,053 |
| 2016 | $1,576 | $15,145 | $2,475 | $12,670 |
| 2015 | $1,527 | $14,816 | $2,475 | $12,341 |
| 2014 | $1,537 | $14,916 | $2,475 | $12,441 |
Source: Public Records
Map
Nearby Homes
- 25065 S Red Oak Dr
- 24322 S Beulah Cove
- 24371 S Lindley Dr
- 9997 E Palm Tree Rd
- 11777 E Oak St
- 25606 S Desert Trail
- 9512 E Sprucewood Dr
- 23049 S King Ridge Dr
- 24922 S Heartwood Dr
- 3015 Frederick Rd
- 23156 S Mae Dr
- 10632 E Dogwood Ct
- 23394 S Becky Blvd
- 0 S Maple Ln
- 9333 E Apple Ln
- 23288 S Bessie Blvd
- 9040 E Tolbert Dr
- 23132 S Jewell Dr
- 23079 Bessie Blvd
- 23036 S Mae Dr
- 10950 E Weston Ln
- 10953 E Weston Ln
- 10952 E Weston Ln
- 24910 S 4140 Rd
- 24900 S 4140 Rd
- 10955 E 530 Rd
- 24950 S 4140 Rd
- 10815 E 530 Rd
- 11094 E 530 Rd
- 11165 E 530 Rd
- 25102 S 4140 Rd
- 10797 E 530 Rd
- 25154 S 4140 Rd
- 10754 E 530 Rd
- 10727 E 530 Rd
- 24825 S Plainview Ave
- 24795 S Plainview Ave
- 11243 E 530 Rd Unit A
- 11243 E 530 Rd
- 24775 S Plainview Ave